# CP – closing price on May 11, 2020. * Once 1st target hit, reset StopLoss at 216. ^ Potential returns are calculated based on the median of buy range.
Verify Ultra Swing Trading 110
To verify our authenticity and credibility, do check the trading position update and recommendation timestamp. Be assured such records are permanent and irreversible.
Tata Motors Limited (NSE: TATAMOTORS) designs, develops, manufactures and sells a broad range of automotive vehicles such as passenger cars, trucks, buses, defence vehicles, sports utility vehicles and related accessories. The company offers its products under Tata, Daewoo, Fiat, Jaguar and Land Rover brands. Incorporated in 1945, Tata Motors Limited has operations in the United States, UK, rest of Europe, China and Internationally. The company reported a consolidated net profit of Rs 1,954.51 crore for the quarter ended December 31, 2019, compared to Rs 26,823.22 crore loss reported during the corresponding period of 2018-19.
TATA MOTORS STOCK INFORMATION
Stock Data
NSE Code
TATAMOTORS
Sectoral Index
Nifty Auto
52W High
201.7
52W Low
63.5
Face Value
2
Nifty vs Wipro Performance
TATA MOTORS TECHNICAL ANALYSIS (WEEKLY)
Wipro NSE WIPRO Price Chart - Weekly
● Looking at the Tata Motors historical share price, the stock had seen a spectacular rally from the bottom of around 11.5 (May 2001) and hit a fresh high of about 199.5 (May 2006).
● Share price of Tata Motors has slipped into sharp decline afterwards, had broken all the support during the 2008 financial crisis and moved near 25.
● The stock was recovered afterwards sharply and witnessed a strong rally during 2009-2015, rallying from ₹25 to lifetime high of ₹612.4. A whopping 2350% gain in just seven years.
● Since it’s lifetime high of ₹612.4 registered during February 2015, TATAMOTORS share price has been in a declining trend.
● After a consistent downtrend in the last five years, the stock price had taken the support on the Ultimate baseline, which corresponds to earlier lows, thereby making it strong support.
● As seen in the Tata Motors share price history, the primary trend is positive since 2001. There is a steady support baseline which is moving upwards along with price rise.
● Overall Tata Motors trend and the broader pattern are bullish, and recent closing above the Primary Trend had given us the opportunity to enter the stock (Inset view).
● Tata Motors share target will be double or more in the next two years.
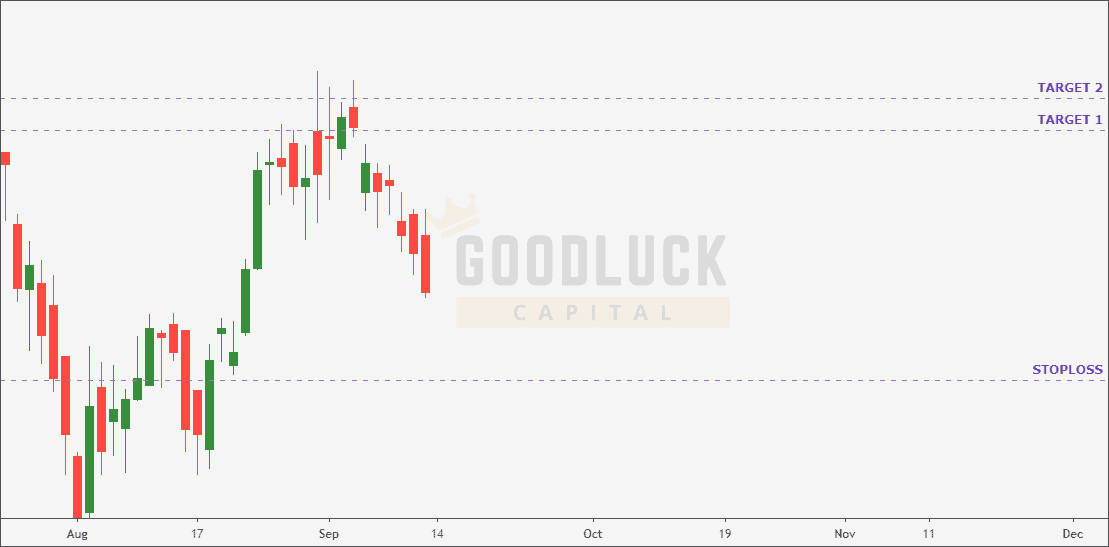
TATA MOTORS TECHNICAL ANALYSIS (DAILY)
Wipro NSE WIPRO Price Chart - Weekly
● As seen in the Tata Motors chart analysis, the OBV is trading above the 15 days MA of it’s on balance volume. Buying pressure is visible as the positive volume exceeds negative volume, and the OBV line rising upwards.
● The OBV measures the volume change with price to identify the smart money are buying and selling the positions in the stock. This suggests you should invest in Tata Motors at dips and build long positions with institutional investors.
CONCLUSION - TATA MOTORS SHARE PRICE FORECAST
Based on our short term trading advice, Tata Motors share price target will be 184 -187 in the next few days.
TATA MOTORS SHARE TRADING UPDATE - POSITION & ACTIVITIES