Introduction
The Indian real estate sector has witnessed significant growth in recent years, driven by increasing demand, policy reforms, and infrastructure development. Two prominent players, DLF Limited and Oberoi Realty Limited, have been at the forefront of this growth, shaping the country’s urban landscape. Both companies have established themselves as leaders in the industry, with a strong presence in residential, commercial, and retail segments.
For investors seeking short term stock trading advice in India, comparing these two giants provides valuable insights into sector momentum and company-specific performance.
Indian Real Estate Sector: Future Growth Prospects
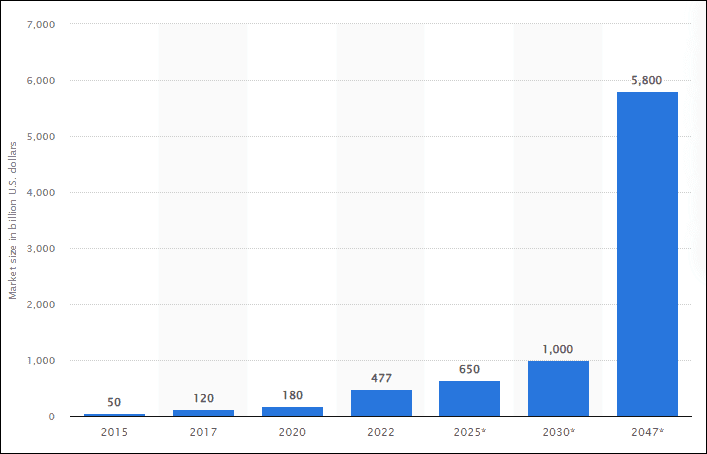
India’s real estate market is expected to register significant growth in the coming years, driven by a number of factors. Here’s a quick summary of the key trends:
● Market size and GDP contribution: The market size is expected to reach US$ 1 trillion by 2030, up from US$ 200 billion in 2021, and contribute 15.5% to GDP by 2047.
● Residential market growth: The residential market is witnessing strong growth, with the value of home sales reaching an all-time high of Rs. 3.47 lakh crore (US$ 42 billion) in FY23. Demand is surging in top 8 cities across mid-income, premium, and luxury segments.
● Retail and office space: The retail and office space segments are also growing rapidly. Gross leasing in top 7 cities crossed 60 million sq ft for the first time in 2023, with technology companies leading leasing activity.
● Data centers: Data center demand is on the rise, with an expected increase of 15-18 million sq ft by 2025.
● Housing shortage: There is a significant housing shortage in urban areas, with the current shortage estimated at 10 million units. An additional 25 million units of affordable housing are required by 2030.
Overall, the Indian real estate sector presents a promising picture for growth and development. The sector is benefiting from a number of factors, including a growing economy, rising urbanization, and increasing disposable incomes. This is leading to strong demand for both residential and commercial properties.
Company Overview
DLF
DLF Limited, along with its subsidiaries, focuses on colonization and real estate development across India. Their activities encompass land acquisition, project planning, construction, and marketing. The company specializes in developing and selling residential projects, while also managing commercial office spaces and retail properties, including malls and hospitality ventures. Notably, it owns The Lodhi Hotel and Hilton Garden Inn in New Delhi, as well as the DLF Golf & Country Club in Gurugram. Additionally, DLF is involved in leasing, maintenance, power generation, and recreational services. Established in 1946, DLF Limited is headquartered in Gurugram and operates as a subsidiary of Rajdhani Investments and Agencies Private Limited.
Oberoi Realty
Oberoi Realty Limited, along with its subsidiaries, focuses on real estate development and hospitality in India. It operates in two main segments: Real Estate and Hospitality. The company develops and sells various projects, including residential, commercial, hospitality, retail, and social infrastructure. It also leases office and retail spaces. Additionally, it manages hotel operations, which include room sales, food and beverage services, and related offerings, as well as constructing residential apartments and providing property management services. Established in 1998, the company is based in Mumbai, India.
Market Capitalization
● DLF – ₹ 2,26,256 Cr. ($26.8 B)
● Oberoi Realty – ₹ 68,970 Cr. ($8.2 B)
Relative Strength
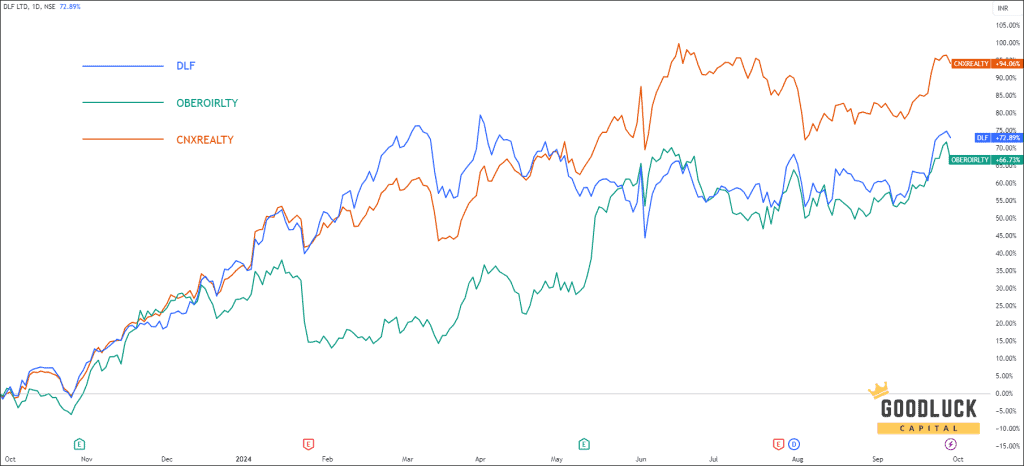
The chart vividly demonstrates that neither company has managed to surpass the performance of the real estate sector over the past year. The realty sector has achieved an impressive return of 94%, while DLF and Oberoi Realty have delivered returns of 73% and 67%, respectively.
Technical Aspects
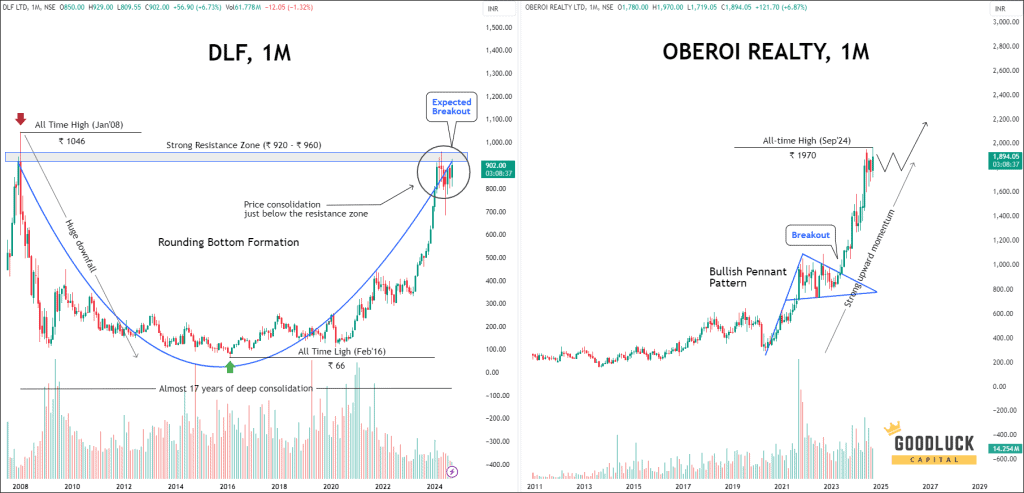
DLF
- Since its listing in July 2007, DLF reached an impressive peak of ₹ 1046 in January 2008.
- However, the stock faced a significant decline following the Lehman Brothers crisis later that year.
- After enduring a lengthy period of consolidation lasting eight years, the price stabilized around ₹ 66 in February 2016 and began its upward trajectory.
- Now, after nearly 17 years of consolidation, the stock is trading just below a critical resistance level, with a breakout anticipated in the near future.
OBEROIRLTY
- Since its launch in December 2010, Oberoi Realty has shown a consistent upward trajectory
- During this ascent, the stock formed a Bullish Pennant pattern, and after breaking out, it surged to an all-time high of ₹ 1970 in September 2024.
- Currently, it is trading just below this peak. Analysts expect the stock to continue its upward momentum and reach new heights in the coming days.
Revenue Breakdown
DLF
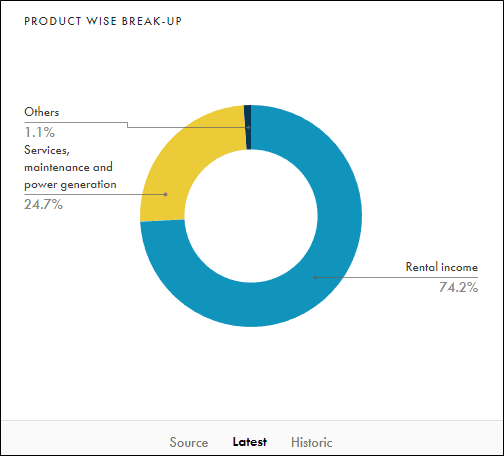
DLF mainly generates its revenue from real estate development, concentrating on both commercial and residential areas. Significantly, the commercial real estate sector contributes a considerable 74% of the company’s total revenue, largely through rental income.
OBEROIRLTY
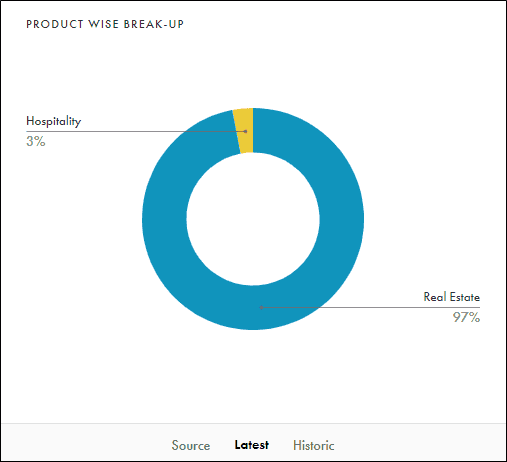
The company predominantly earns around 97% of its revenue from the real estate development sector. Furthermore, it also participates in the hospitality industry, which adds the remaining 3% to its overall revenue.
Revenue & Profit Analysis
DLF
- Over the past three years, DLF has recorded a modest compounded annual growth rate of 6% in sales.
- Despite this, the company has seen remarkable profit growth, which surged by 33% during the same timeframe.
- Currently, DLF enjoys a robust operating profit margin of 33%, an increase from 30% in FY23.
- In fiscal year 2024, earnings per share have jumped to 11.02, up from 8.22 the previous year, reflecting a consistent upward trend in EPS over the last four years.
OBEROIRLTY
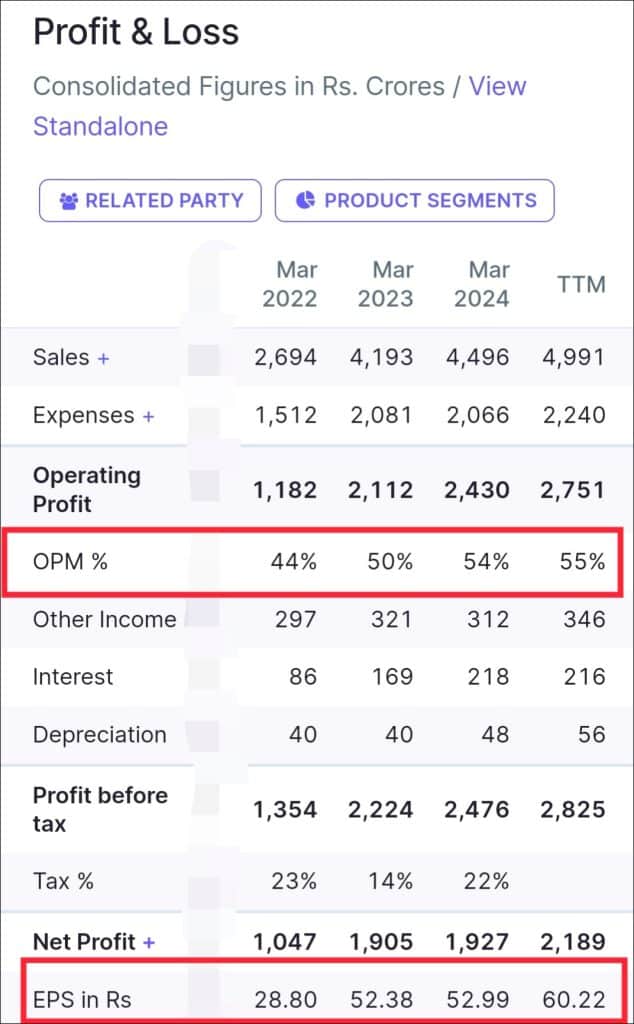
- In the last three years, Oberoi Realty has achieved an impressive compounded annual growth rate of 30% in sales.
- Profit growth has closely mirrored this success, with a CAGR of 34% during the same period.
- The company currently boasts an outstanding operating profit margin of 55%, a figure that continues to rise.
- While the EPS growth from FY23 to FY24 is modest, with EPS standing at 52.99 compared to 52.38 the previous year, the overall trend in EPS has been positive over the last four years.
Valuation
P/E Ratio
- DLF’s current price-to-earnings (P/E) ratio stands at 79.6, slightly exceeding its 1-year median P/E of 76.7. However, when juxtaposed with the industry average of 34.4, it becomes evident that DLF is significantly overvalued at this time.
- In contrast, Oberoi Realty presents a P/E ratio of 31.50, which is just above its 1-year median P/E of 29.6. Yet, when compared to the industry P/E of 34.4, it appears to be undervalued.
P/B Ratio
- DLF’s price-to-book (P/B) ratio is 5.74, indicating a substantial overvaluation relative to the industry average of 3.54.
- Similarly, Oberoi Realty also seems overvalued with a P/B ratio of 4.98.
PEG Ratio
Oberoi Realty’s PEG ratio of 1.83 positions it as an attractive investment opportunity, especially when compared to DLF’s considerably higher PEG of 4.79.
Profitability Analysis
- DLF ROCE – 6% in FY24
- OBEROIRLTY ROCE – 15% in FY24
These numbers clearly demonstrate that Oberoi Realty is more profitable than DLF, as it efficiently leverages its total capital—comprising both equity and debt—to yield higher returns.
Capex Analysis
DLF
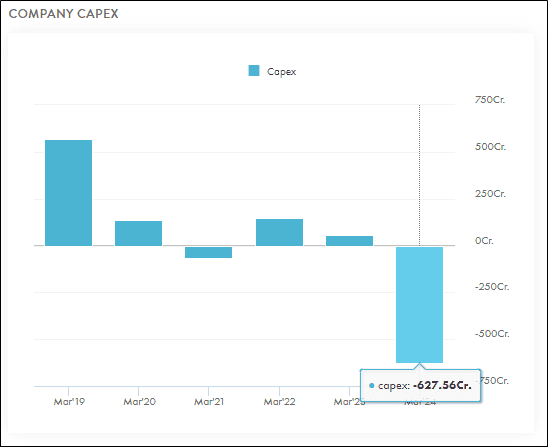
- The cash flow statement for DLF reveals a negative capital expenditure, indicating that the company is selling or disposing of its existing capital assets.
- This suggests a strategic decision to reduce its portfolio of office spaces and similar fixed assets, as they are no longer deemed necessary.
OBEROIRLTY
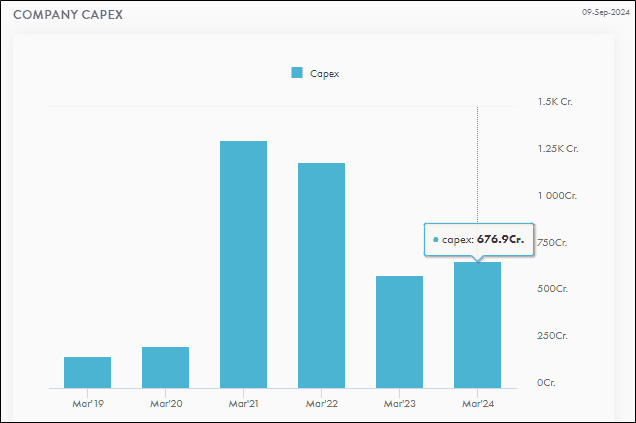
- In contrast, Oberoi Realty has ramped up its capital expenditure from 601 crore to 677 crore compared to the previous year.
- This increase is a positive sign for the company, reflecting its ambition for expansion and growth in the market.
Cash Flow Analysis
DLF
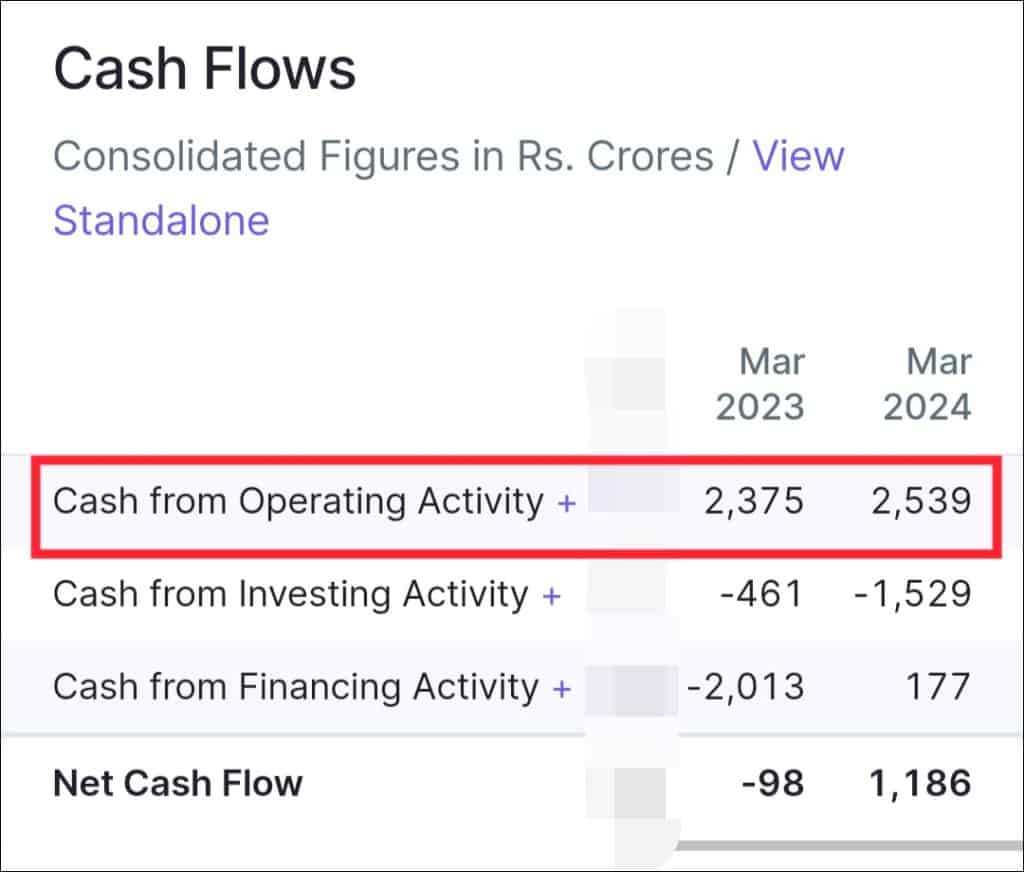
DLF has demonstrated impressive growth in its operating cash flow, rising to 2,539 crore from 2,375 crore in FY23.
OBEROIRLTY
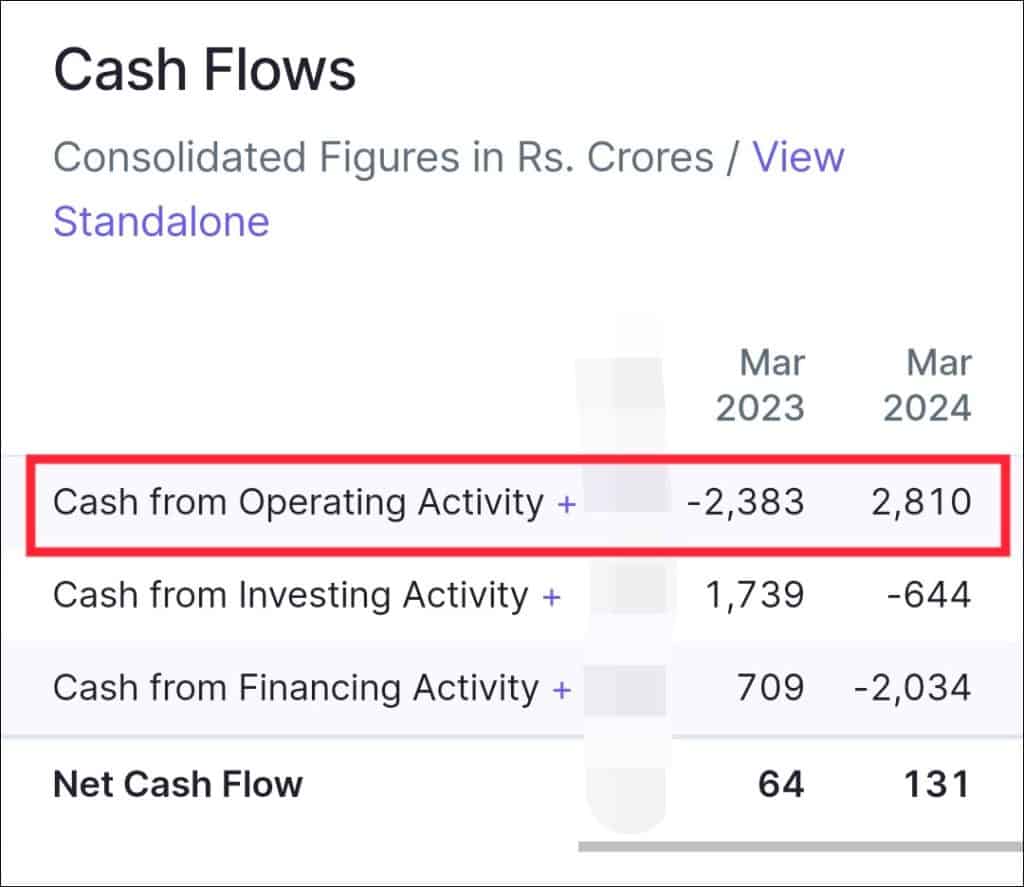
Oberoi Realty has also performed exceptionally well, transforming its cash from operations to an impressive 2,810 crore, marking a significant recovery from a considerable negative of 2,383 crore in FY23.
Debt Analysis
- DLF demonstrates robust financial health with a manageable debt level of 4,894 crores and an impressive debt to equity ratio of just 0.12, signaling that debt is not a significant issue for the company.
- On the other hand, Oberoi has a debt of 2,495 crores, resulting in a debt to equity ratio of 0.18, which indicates that the company is also not worried about its debt situation.
Shareholding Pattern
DLF
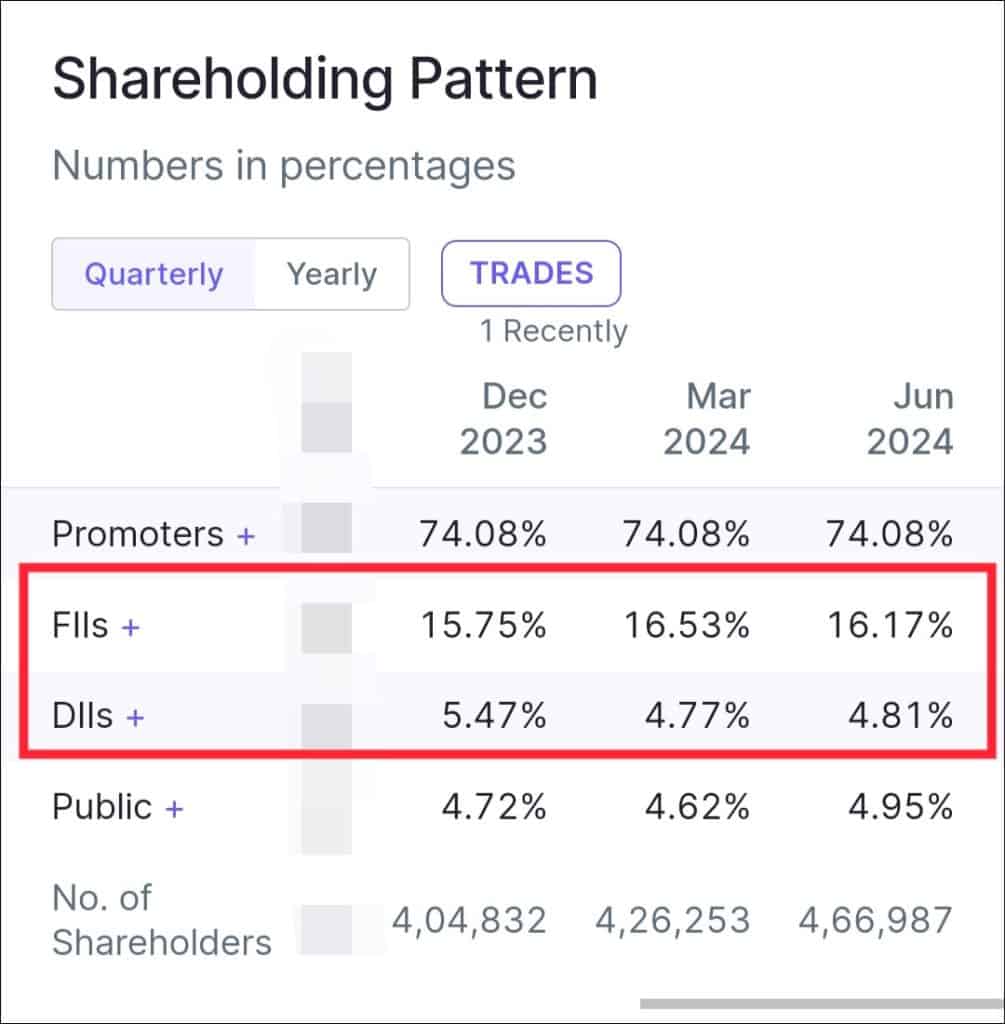
- Currently, Foreign Institutional Investors (FIIs) possess a 16.17% stake, reflecting a decline from the previous quarter.
- On the other hand, Domestic Institutional Investors (DIIs) have increased their holdings to 4.81% as of the June quarter, a slight rise from 4.77% in the last quarter.
OBEROIRLTY
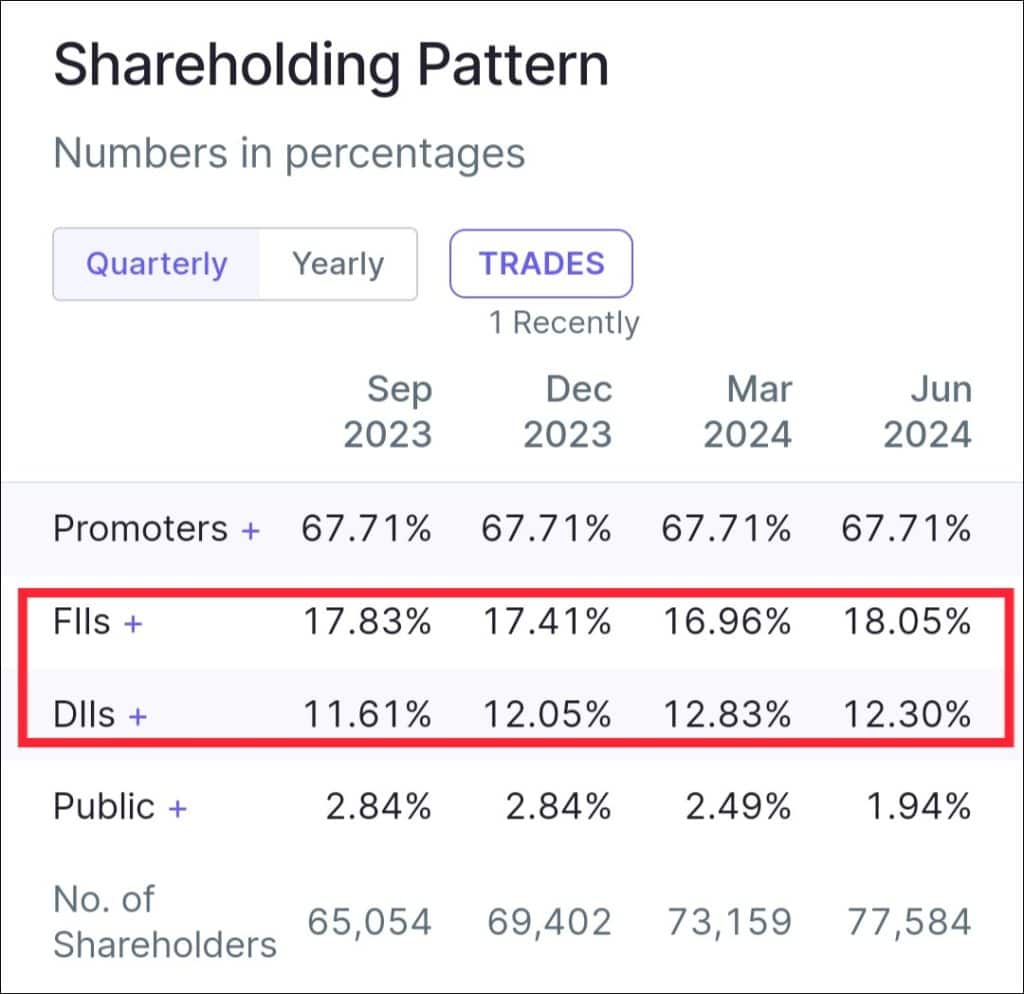
- Foreign Institutional Investors (FIIs) have made a notable increase in their investment in this stock, now holding 18.05%, up from 16.96% in the last quarter.
- Conversely, Domestic Institutional Investors (DIIs) have reduced their stake to 12.30%, down from 12.83% in the March quarter.
Conclusion
Oberoi Realty clearly outperforms DLF across profitability, valuation attractiveness, revenue momentum, and expansion strategy. While DLF stands at the cusp of a multi-year breakout — which could reward long-term investors — Oberoi’s stronger fundamentals make it a superior pick at this point.
As India’s real estate sector continues its massive growth journey, both companies are positioned to gain from rising demand. For investors seeking disciplined market participation, especially those following positional trading tips in India, monitoring these two giants closely could unlock substantial opportunities in the coming years.