StopLoss*: Apply on the daily close. After the first target, reset the StopLoss to your buying price.
Duration^: Approximate holding period based on the active trading days (excluding market holidays). Actual holding may vary with the market conditions.
Upside Potential#: Based on median of the suggested buy range.
The Phoenix Mills Limited is a leading Indian real estate company engaged in mall operations, commercial and residential development, and hospitality.
It operates across property & related services, hospitality, and residential segments. The company owns and manages premium shopping malls, office spaces, homes, and hotels across major Indian cities.
Phoenix Mills operates well-known malls such as Phoenix MarketCity, Phoenix Palladium, Palladium, Phoenix Mall of Asia, and others. In hospitality, it runs hotels under The St. Regis and Courtyard by Marriott brands.
Founded in 1905, the company is headquartered in Mumbai, India.
Strong Financials: Revenue grew 22% YoY to ₹1,115 Cr; EBITDA rose 29% YoY to ₹667 Cr with ~60% operating margin.
Retail Momentum: Mall consumption increased 14% YoY to ₹3,750 Cr; rentals up 10% YoY. Phoenix Mall of Asia led with 78% growth.
Residential Revival: Gross sales jumped to ₹139 Cr (vs ₹27 Cr YoY); collections improved to ₹116 Cr.
Commercial & Hotels: Office occupancy improved to ~77%; hospitality revenues stable while EBITDA grew 13%.
Balance Sheet: Interest costs down ~11% YoY; strong cash flows support future expansion.
Financial Highlights
Metric
Q2 FY26
Q1 FY26
Q2 FY25
QoQ Growth
YoY Growth
Revenue from Operations (₹ Cr)
1,115.40
953
918
17.04%
21.50%
EBITDA (₹ Cr)
666.9
564.3
517.7
18.18%
28.82%
EBITDA Margin (%)
59.80%
59.20%
56.40%
+0.60 bps
+340 bps
Profit After Tax (₹ Cr)
303.99
320.86
218.1
-5.26%
39.38%
Earnings Per Share (₹)
8.5
6.73
8.17
26.30%
4.04%
Retail Consumption (₹ Cr)
3,750.00
3,588.00
3,289.00
4.52%
14.02%
Price Performance & Volume Analysis
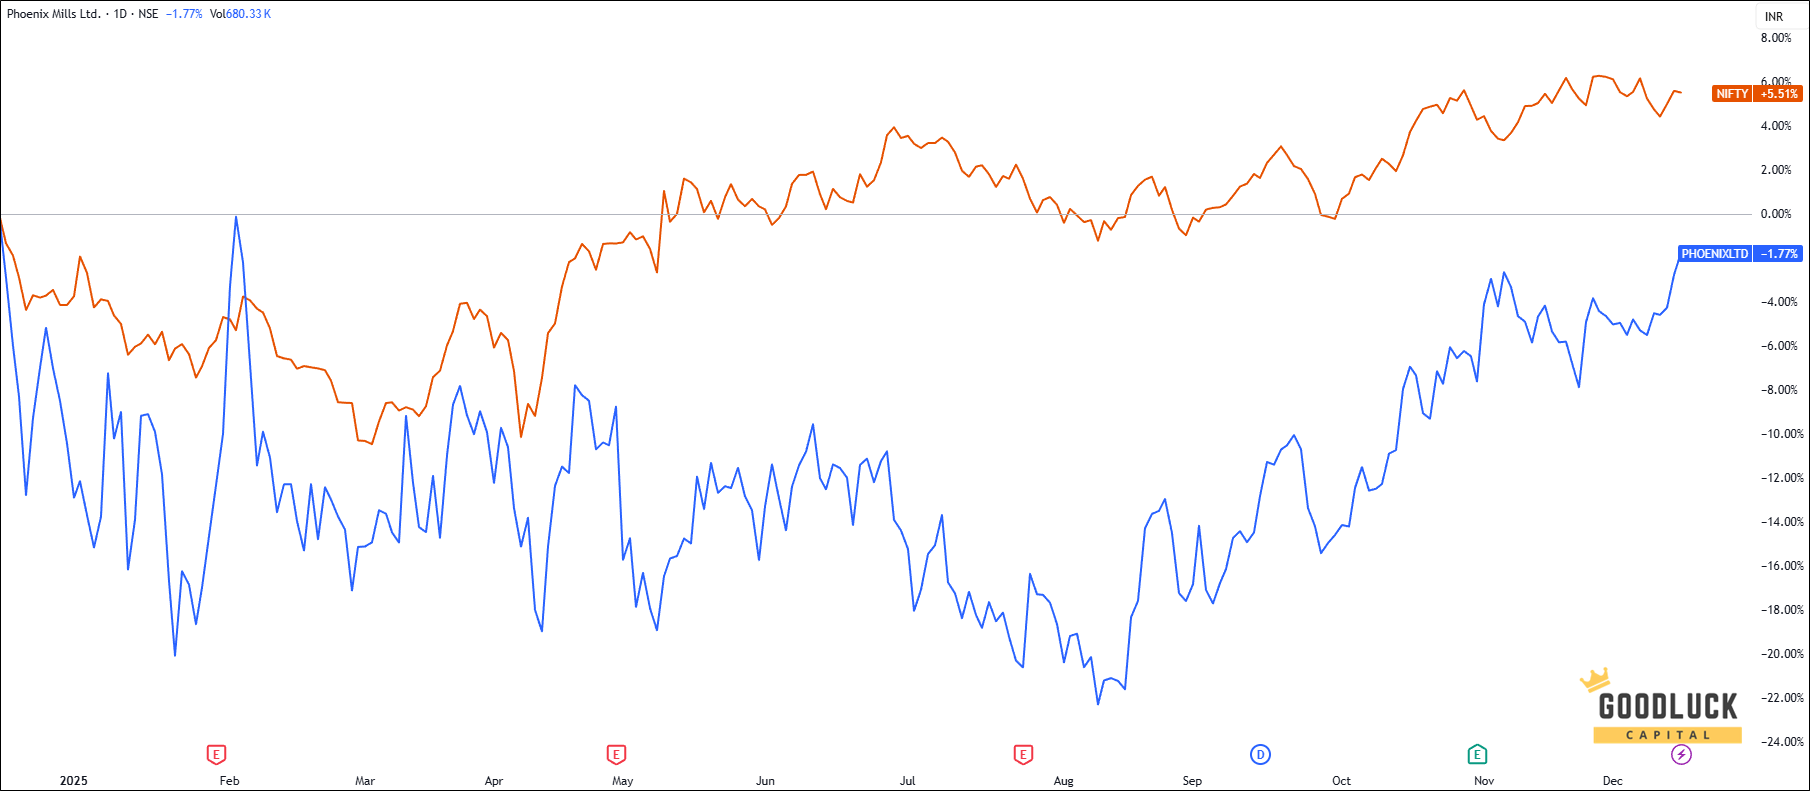
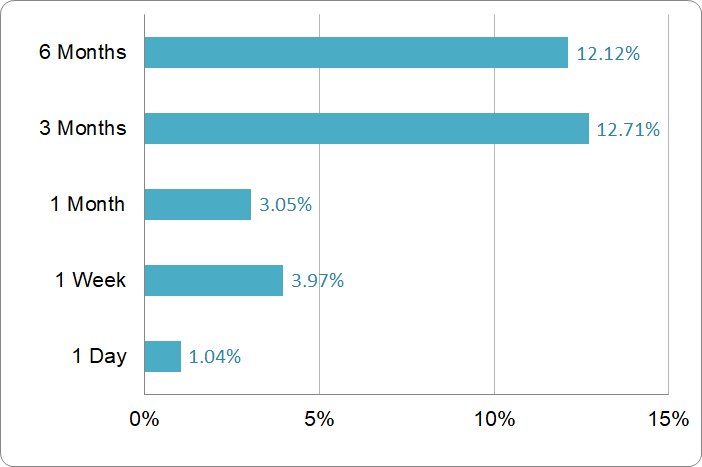
Price Performance
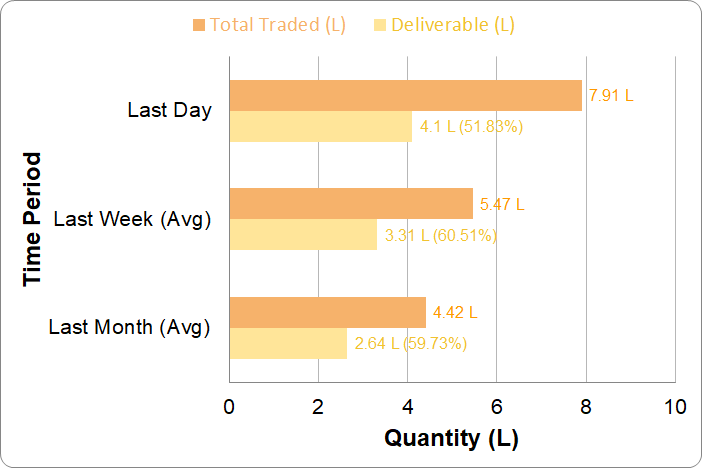
Volume Analysis
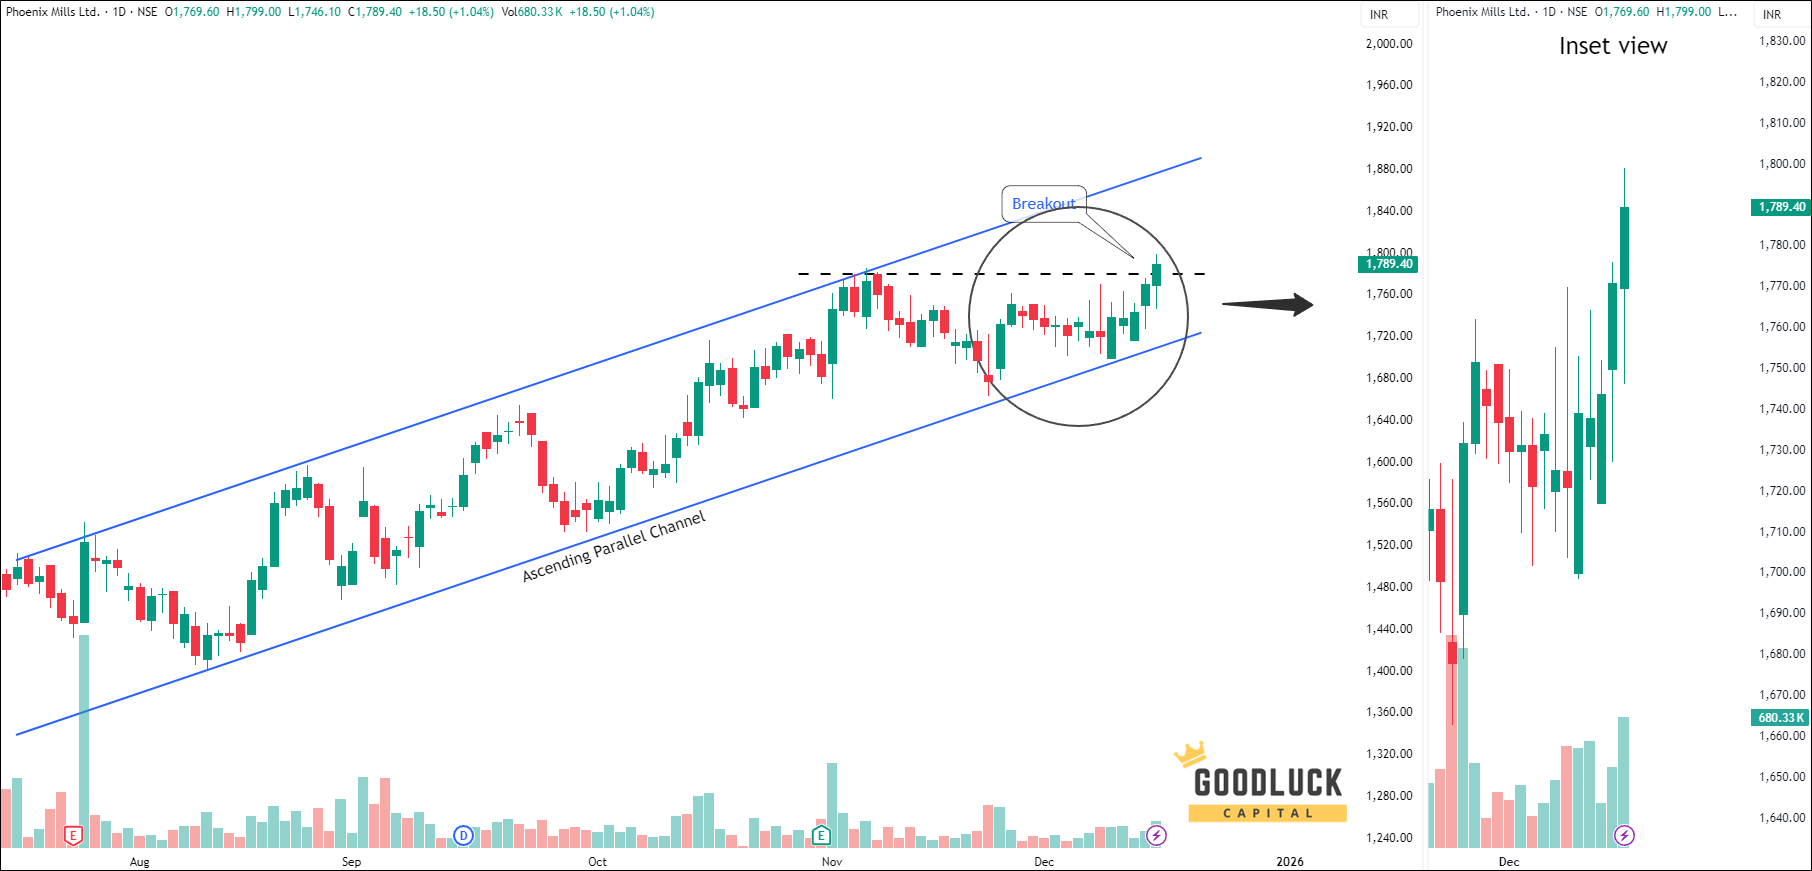
Technical Analysis
Key Observations
The stock is trading in a steady uptrend within a parallel channel.
After bouncing off the lower boundary, the price is now moving toward the upper boundary, indicating continued bullish momentum.
With reliable positional stock tips in India, traders can stay aligned with short-term trends that build quietly but steadily.
Technical Image - Daily Timeframe
Technical Indicators
Oscillators
Indicator
Value
Zone
RSI-14
66.17
Neutral
CCI-14
238.33
Overbought
MFI
62.75
Neutral
ROC
2.78
Positive
Stochastic %K
86.92
Overbought
William %R
-9.55
Overbought
Exponential Moving Averages (EMAs)
EMA
Value
Stock Position
5 EMA
1761
Above
10 EMA
1748
Above
20 EMA
1738
Above
50 EMA
1696
Above
100 EMA
1655
Above
200 EMA
1632
Above
Conclusion
Phoenix Mills Stock Price Forecast
Based on our swing trading share tips, the Phoenix Mills Stock Price target will be INR 1855 - INR 1870 in the next 12-14 trading sessions.
MONEY MANAGEMENT AND TRADING RULES
Buy within the recommended price range. You may allow up to 1% flexibility beyond the range if needed.
No need to rush. The recommendation remains valid for up to 7 days, not just at market open.
Use a trailing stop-loss to protect and lock in profits.
Diversify your trading capital across our other recommended stocks to reduce risk.
Invest responsibly. Trade only with funds you can afford to lose and hedge positions where appropriate.
Analyst Summary
The research analysis is prepared by Arijit Banerjee, CMT, CFTe. He is a veteran trader and an active investor having in-depth knowledge in financial market research, advanced technical analysis, market cycle, algorithmic trading and portfolio management. Arijit is a Chartered Market Technician (CMT) accredited by CMT Association USA, the leading global authority of Technical Analysis and has been honoured by Certified Financial Technician (CFTe) from the International Federation of Technical Analysts, USA. SEBI, the regulatory body of Indian financial market also recognizes him as a Research Analyst (INH300006582).
The views expressed herein are based solely on information available publicly/internal data/other sources believed to be reliable, but is not necessarily all-inclusive and is not guaranteed as to accuracy. The recommendations provided herein is solely for informational purposes and are not intended to be and must not be taken alone as the basis for an investment/trading decision. Trading and investing are subject to market risk and the securities discussed and opinions expressed herein may not be suitable for all investors. To read the full disclosure, please click here.
Your Return Could be Much Better
Increase your Profitable!
Swing Trading Advice
10—12 swing trade advice / month
expected upside 6%—8% per trade
short term trade holding 1-2 weeks
minimum capital required ₹ 3-lakh
receive trade advice before 9:00 am
trade ideas by blackbox system, relied on statistics, technical, fundamental, macroeconomics and sentiment