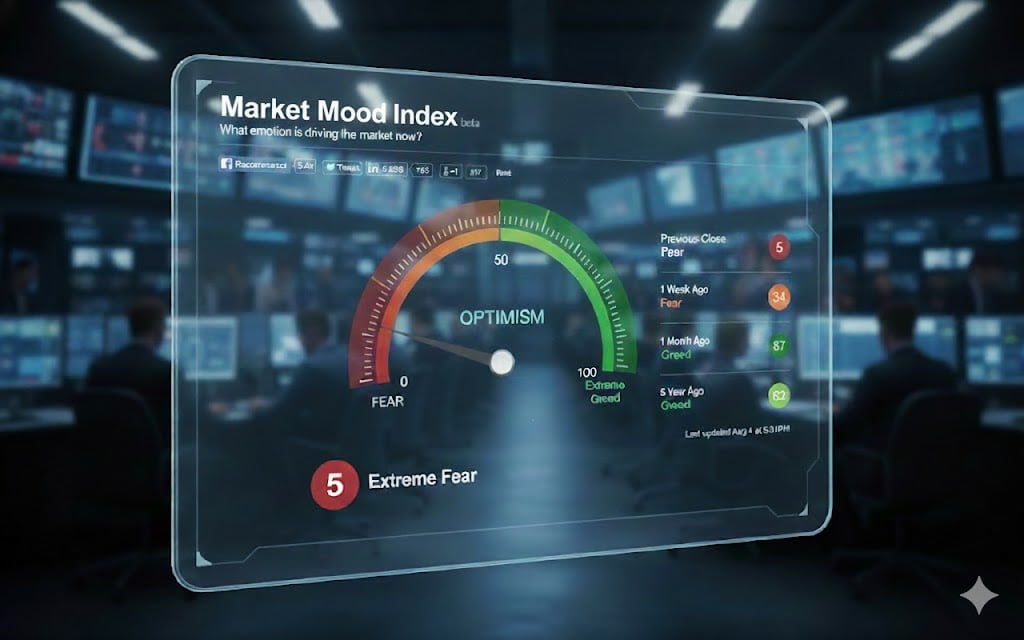
Imagine if the entire Indian stock market had a mood ring—one that tells you whether it’s feeling euphoric, terrified, or somewhere in between. That’s precisely what the Market Mood Index (MMI) does. It’s not just a number; it’s the emotional pulse of millions of Indian investors compressed into a single, easy-to-read gauge that swings between 0 and 100, like a pendulum of sentiment.
Think of the MMI as your market’s mood meter. When you’re happy, you spend money freely; when you’re scared, you lock your wallet. The stock market operates on the same psychology, except the stakes are infinitely higher. The MMI captures this collective emotional state in real-time, separating rational analysis from the very human tendency to panic-sell or greedily buy at the worst times.
The Secret Sauce: What Powers the MMI?
The MMI isn’t guessing—it’s calculating. To understand how your market truly feels, the index analyzes multiple emotional indicators:
FII-DII Activity: Foreign Institutional Investors (FIIs) and Domestic Institutional Investors (DIIs) are like the big players in a poker game. When they’re buying aggressively, market sentiment shifts toward “greed”; when they’re selling frantically, it swings toward “fear”.
India VIX (The Fear Gauge): Often called India’s anxiety meter, the VIX measures the expected volatility of Nifty 50 options over the next 30 days. A rising VIX is like watching barometer pressure drop before a storm—it signals uncertainty and worry.
Price Momentum: This tracks whether stocks are moving up or down. When prices are at multi-year highs, greed peaks. When they crash to multi-year lows, fear dominates.
Technical Overbought/Oversold Levels: The MMI checks if the Nifty 50 and Sensex are stretched beyond their natural limits—like a rubber band pulled too tight, ready to snap.
Global Market Movements: The world’s mood affects India’s markets. A crash in Wall Street or turbulence in European markets ripples through Indian indices instantly.
Demand For Gold: This is a fascinating indicator—when investors get nervous, they flock to safe-haven assets like gold. Rising gold demand signals growing investor anxiety and fear in the market, pushing the MMI toward the fear zone. Conversely, when investors are confident and greedy, they reduce gold holdings to chase higher stock market returns, pushing the MMI toward greed. Gold demand acts as a real-time barometer of investor confidence—it’s like watching money flow between safety and opportunity.
The Five Zones: From Panic to Euphoria
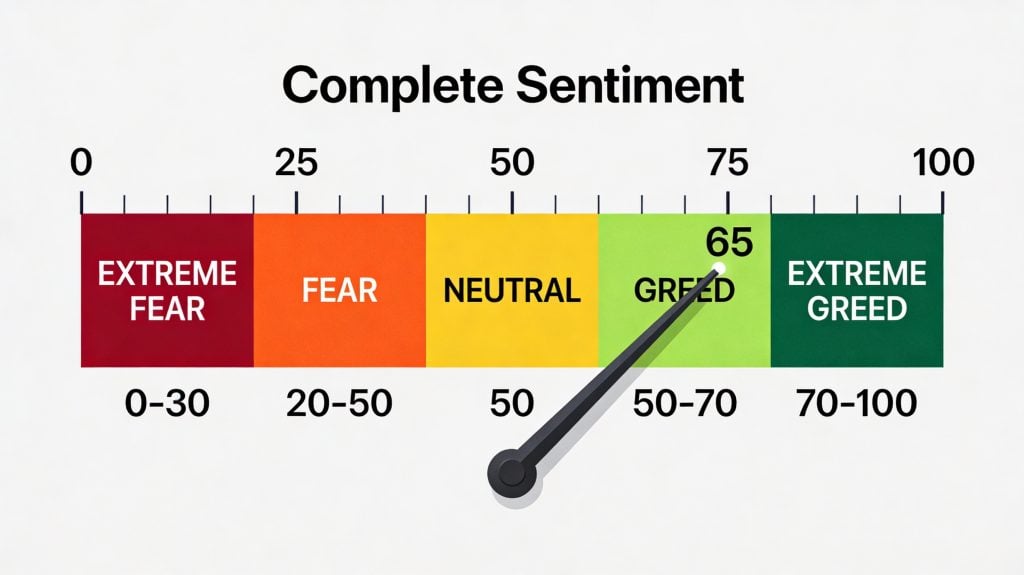
Understanding MMI zones is like learning a new language—the language of market emotions:
Extreme Fear (0-29): Investors are capitulating. They’re selling indiscriminately, sometimes even ignoring quality stocks’ fundamentals. Historically, this zone has been where fortunes are made—smart money buys when others are terrified. When Warren Buffett said “be fearful when others are greedy and greedy when others are fearful,” this is the zone he meant.
Fear (30-49): The market is cautious but not in full panic mode. Investors are holding back, waiting for signs of stabilization before committing fresh capital.
Neutral (50): Pure equilibrium. The market has no emotional bias and could go either direction. Think of it as the eye of the storm.
Greed (51-70): Rising optimism takes over. Investors are confident, buying aggressively, and prices are moving up. But danger lurks—the market might be overbought. This is where FOMO (Fear of Missing Out) drives prices higher than fundamentals justify.
Extreme Greed (71-100): Market euphoria at its peak. Investors are throwing caution to the wind, prices are sky-high, and rationality has left the building. Historically, market corrections follow extreme greed by weeks or months.
Why Indian Investors Need the MMI
Here’s the uncomfortable truth: Indians are prone to emotional investing. Studies show that behavioural biases like herding, overconfidence, and loss aversion heavily influence Indian retail investors’ decisions. The MMI cuts through this emotional fog by quantifying sentiment objectively.
The Indian market is also unique—it has witnessed explosive participation from retail investors, with over 7 million new demat accounts opened in recent years. These retail investors, often lacking professional expertise, tend to amplify sentiment swings. The MMI helps them recognize when they’re being swept away by the crowd.
Moreover, FII flows dominate the Nifty 50, and their buying/selling patterns create massive sentiment shifts overnight. The MMI tracks these institutional moves, revealing which way the “smart money” is actually moving.
Practical Strategies: How to Use MMI Like a Pro
Time Your Entries and Exits: If MMI is in extreme fear below 20-30, and a stock you’ve been eyeing hits its support level, you’ve potentially found a buy opportunity. Conversely, when MMI crosses above 80, it might be time to trim positions or take profits.
Risk Management Magic: In extreme greed zones, reduce your equity exposure or activate hedging strategies like protective puts. In extreme fear, you might increase equity allocation because valuations are attractive.
Combine with Technical Analysis: The real power unlocks when you merge MMI with technical analysis. If the MMI signals extreme fear and the Nifty 50 is near a major support level, that’s a powerful buy signal. This combination has proven more accurate than either signal alone.
Contrarian Gold: Remember, extreme sentiment zones are contrarian indicators. When everyone is terrified (MMI below 20), that’s often when the smartest money buys. When everyone is greedy (MMI above 80), it’s time to be cautious.
The Real Test: Does MMI Actually Work?
Academic research confirms what traders have long suspected: investor sentiment significantly influences stock returns in the Indian market. Studies show that a 1% change in sentiment leads to approximately 0.19% change in Nifty 500 returns. The effects are even stronger in specific sectors—particularly in stocks that are “hard to value,” like small-caps and penny stocks.
The MMI isn’t a crystal ball, but it’s the closest thing investors have to reading the market’s actual psychological temperature.
Final Thought
The Market Mood Index strips away the noise and noise-makers. It reveals that markets aren’t purely rational information-processing machines—they’re driven by human psychology, institutional flows, and collective emotional cycles. By monitoring the MMI, Indian investors can stop being slaves to their emotions and start being masters of market timing.
The next time Sensex drops 500 points and your phone starts buzzing with panic messages in your investment groups, take a breath. Check the MMI. If it’s showing extreme fear, remember: the market’s panic might be your opportunity’s doorbell ringing.
If you are looking for a SEBI registered trading advisory in India, consider subscribing to our services.