Mid term Investment Advice (A): Information Technology stock | 25-30% target | Indian stock investing recommendation on 16 Jan 2026
- January 16, 2026
- 9:00 am
- Goodluck Capital
NOTE
-
Closing Price: ₹191 (as of Jan 14, 2026)
-
StopLoss*: Apply on the daily close. After the first target, reset the StopLoss to your buying price.
-
Duration^: Approximate holding period based on the active trading days (excluding market holidays). Actual holding may vary with the market conditions.
-
Upside Potential#: Based on median of the suggested buy range.
Moschip Technologies Limited (Established 1999) is India’s first fabless public semiconductor company, headquartered in Hyderabad. The company operates as a fabless semiconductor and product engineering services provider, designing complex semiconductor solutions without owning manufacturing facilities.
Website: http://www.moschip.com/
Key Corporate Facts:
- Listed: NSE (MOSCHIP), BSE (532407)
- Headquarters: Hyderabad, India
- Global Presence: Silicon Valley (USA), Bangalore, Pune, Ahmedabad
- Workforce: 1,300+ semiconductor design engineers
- Experience: 25+ years in semiconductor design and IP development
Business Operations
Core Service Offerings:
Moschip's business encompasses three primary revenue streams:
- ASIC Design Services – Custom semiconductor design for enterprise clients
- IP Licensing – Proprietary intellectual property for mixed-signal and digital designs
- Product Engineering – Complete product development from concept to silicon
Technical Capabilities:
- End-to-end ASIC and System-on-Chip (SoC) design
- Mixed-signal IC design for analog and digital integration
- Embedded system design and firmware development
- Design verification and validation services
- Silicon IP cores and reusable design blocks
Application Domains:
- Consumer Electronics & IoT devices
- Automotive Electronics & EV systems
- Data Center & Cloud Infrastructure
- Aerospace & Defense
- Medical & Healthcare Devices
- Networking & Telecommunications
Strategic Positioning
Competitive Advantages:
- First-Mover Status: Only fabless public semiconductor company in India
- Government Alignment: Approved vendor under Semiconductor Design Linked Incentive (DLI) scheme
- Strategic Partnerships: Collaborations with C-DAC, Tenstorrent, EMASS, and industry leaders
- Diverse Client Base: Trusted by Fortune 500 companies across multiple sectors
- Integrated Capability: From silicon design to product engineering solutions
Market Position:
Moschip occupies a unique niche as an end-to-end semiconductor design services provider with both ASIC design services and proprietary IP licensing revenue, differentiating it from pure design service firms.
Year-on-Year Analysis
The company exhibits exceptional financial growth with profits expanding faster than revenue, indicating strong operational leverage and margin expansion.
| Period | Revenue (₹ Cr) | Net Profit (₹ Cr) | Profit Margin | EPS (₹) |
|---|---|---|---|---|
| FY 2023 | 198 | 5.1 | 2.60% | 0.37 |
| FY 2024 | 294 | 10 | 3.40% | 0.53 |
| FY 2025 | 467 | 33 | 7.10% | 1.75 |
| TTM | 543 | 43 | 7.90% | 2.23 |
| FY25 Growth | 58.84% | 230% | +3.7pp | 230% |
FY 2024 vs FY 2023:
- Revenue growth: 48.5% (₹294 Cr vs ₹198 Cr)
- Profit growth: 96% (₹10 Cr vs ₹5.1 Cr)
- Margin expansion: 80 basis points
FY 2025 vs FY 2024:
- Revenue growth: 58.84% (₹467 Cr vs ₹294 Cr)
- Profit growth: 230% (₹33 Cr vs ₹10 Cr)
- Margin expansion: 370 basis points
- Exceptional operational leverage evident
Quarterly Performance
| Quarter | Revenue (₹ Cr) | Net Profit (₹ Cr) | Profit Growth |
|---|---|---|---|
| Q1 FY26 (Jun 2025) | 135.58 | 10.89 | +174% YoY |
| Q2 FY26 (Sep 2025) | 146.94 | 12.15 | +25% YoY |
| H1 FY26 Total | 282.53 | 23.04 | +37% YoY |
Key Observation: Sequential quarter growth shows profit expansion (Q1: ₹10.89 Cr → Q2: ₹12.15 Cr), indicating sustainable operational momentum.
Historical Growth Metrics
| Period | Revenue CAGR | Profit CAGR |
|---|---|---|
| 10-Year | 55% | 25% |
| 5-Year | 36% | 26% |
| 3-Year | 47% | 73% |
| 1-Year (TTM) | 46% | 155% |
Critical Insight: The 80% five-year stock price CAGR reflects exceptional shareholder value creation, while current 0% one-year return indicates consolidation after substantial gains.
Profitability & Margin Analysis
Margin Expansion Trajectory:
The company demonstrates improving operational efficiency with margins expanding across profit levels:
| Metric | FY24 | FY25 | Improvement |
|---|---|---|---|
| Gross Margin | ~45% | ~48% | +3pp |
| Operating Margin | 3.40% | 7.10% | +3.7pp |
| Net Profit Margin | 3.40% | 7.10% | +3.7pp |
| Operating Leverage | Moderate | Strong | Evident |
Margin Expansion Drivers:
- Better project mix with higher-value AI/IoT designs
- Improved pricing power with established clients
- Operating scale benefits reducing per-unit costs
- Higher utilization of engineering resources
- Increased proportion of IP licensing revenue
Asset Base & Equity Structure (As of Sep'25)
Balance Sheet Composition:
| Item | Value (₹ Cr) | % of Total |
|---|---|---|
| Total Assets | 538 | 100% |
| Total Equity | 367 | 68% |
| Total Liabilities | 171 | 32% |
| Equity Capital | 38 | 7% |
| Reserves & Surplus | 329 | 61% |
Capital Structure Assessment:
The balance sheet reflects a fortress-like financial position with:
- Equity comprising 68% of total capital (exceptionally strong)
- Minimal financial leverage with low debt burden
- Reserves built from accumulated profits (₹329 Cr)
- Conservative capital structure enabling growth investments
Liquidity & Solvency Metrics
| Metric | Value | Assessment |
|---|---|---|
| Current Ratio | 2.40x | Excellent |
| Debt-to-Equity | 0.06x | Minimal leverage |
| Equity Ratio | 68% | Very strong |
| Interest Coverage | Strong | Very safe |
| Net Cash Position | Positive | ₹130.63 Cr |
Receivables Management
One of the most impressive improvements is working capital efficiency:
- Debtor Days: Improved to 69 days (from 112 days)
- Improvement: 40% reduction in collection period
- Significance: Superior cash conversion and customer quality
Return on Capital Metrics
Capital Efficiency Analysis:
| Metric | Value | Trend |
|---|---|---|
| ROE (Return on Equity) | 11.20% | Improving |
| ROCE (Return on Invested Capital) | 11.90% | Improving |
| ROA (Return on Assets) | 7.54% | Improving |
| Book Value per Share | ₹ 19.10 | Accretive growth |
Interpretation: Improving returns on capital demonstrate that the company is deploying capital efficiently into growth initiatives with positive returns.
Current Valuation Metrics (Jan 16, 2026)
| Metric | Current Value | Context |
|---|---|---|
| Share Price | ₹ 191.00 | - |
| Market Cap | ₹3,675 Cr | Mid-cap stock |
| P/E Ratio | 86x | Premium valuation |
| P/B Ratio | 10x | Premium valuation |
| Market Cap/Sales | 7.5x | Growth premium |
| Dividend Yield | 0.00% | Reinvestment focus |
Valuation Justification
The market assigns a premium valuation (86x P/E) reflecting the company's growth trajectory:
- Explosive Earnings Growth: 230% YoY profit growth justifies premium multiples
- Sustainable Tailwinds: Government support for semiconductors creates long-term growth visibility
- Limited Competition: Few Indian companies in fabless semiconductor space
- Strategic Positioning: Beneficiary of India's $100B semiconductor market vision
- Margin Expansion: Operating leverage supports future profitability improvements
PEG Ratio Analysis
The PEG Ratio (Price-to-Earnings-Growth) provides a more accurate valuation perspective:
PEG Ratio = P/E Ratio ÷ Earnings Growth Rate = 86 ÷ 230 = 0.38
Interpretation:
- PEG Ratio < 1.0x = Attractive valuation
- Moschip's 0.38x = Highly attractive
- Company doubling profits every 1-2 quarters
- Even conservative growth assumptions support valuation
Semiconductor Industry Tailwinds
Global Market Dynamics:
The semiconductor industry is experiencing structural growth driven by multiple secular trends:
- Global Market Growth: 11%+ annual growth rate
- 2024 Performance: Semiconductor sales grew 19% YoY
- Primary Drivers: AI servers, data centers, edge computing, automotive
- India Opportunity: Domestic market growing faster than global average
India's Semiconductor Market Opportunity
Massive Domestic Market Expansion:
| Year | India Market Size | Growth |
|---|---|---|
| 2024 | $51.1 Billion | Baseline |
| 2026 | $73 Billion | 43% |
| 2030 | $100 Billion | +37% CAGR |
| Local Chip Design | $20 Billion (by 2030) | 20% of total |
Strategic Context: India's government vision to build indigenous semiconductor capability creates structural demand for design services companies like Moschip.
Technology Trend Opportunities
AI/ML Chip Design Boom:
- Explosive demand for custom AI accelerators
- Edge AI processors for IoT devices
- Neural processing units for automotive
- Moschip positioned to capture this wave
Automotive Electrification:
- EV semiconductor requirements 2-3x higher than traditional vehicles
- Complex SoCs for autonomous driving
- Battery management and power electronics chips
- Growing demand for design services
IoT/Connected Devices:
- Billions of connected devices requiring custom chips
- Low-power SoCs for sensor networks
- Secure enclave designs for IoT security
- Moschip's core competency area
5G/6G Infrastructure:
- Network processors and RF ICs
- Base station controller designs
- Mobile processor customization
- Design complexity driving outsourcing
Strategic Initiatives & Execution
ProductXcelerate Blueprints:
- Pre-validated reference designs for OEMs
- Accelerates product time-to-market
- Recurring licensing revenue opportunity
AgenticSky AI Cores:
- VisionCore (image & video processing)
- HMICore (human-machine interface)
- ControllerCore (embedded systems control)
- WearableCore (wearable device optimization)
Capacity Expansion:
- Scaling workforce from 1,300 to 2,000+ engineers
- New offices in Bangalore and Pune
- Enhanced R&D capabilities
- Improved project execution capacity
Government Partnerships:
- C-DAC collaboration for indigenous HPC processors (AUM project)
- Semiconductor Design Linked Incentive (DLI) scheme benefits
- Strategic alignment with national mission
Operational Risks
Scaling Execution Risk
- Expanding from 1,300 to 2,000+ engineers challenges quality control
- Maintaining culture and knowledge during rapid growth
- Project delivery consistency critical for client retention
Talent Acquisition & Retention
- Intense global competition for semiconductor design talent
- Geographic constraints (engineers concentrated in metros)
- Cost inflation in key talent markets
Technology Obsolescence
- Semiconductor design methodology evolving rapidly
- Continuous R&D investment required
- Tool and technology stack updates mandatory
Customer Concentration
- Revenue dependency on few large customers
- Loss of major customer could impact growth
- Contract renewal risks on long-term projects
Market & Industry Risks
Macroeconomic Cyclicality
- IT capex cycles directly impact design services demand
- Global recession could reduce semiconductor design spending
- Automotive cycle downturns affect chip design work
Competitive Intensification
- Established IT services firms (TCS, Infosys, HCL) expanding semiconductor offerings
- New entrants emerging with government subsidies
- Price competition could emerge with scale
Technology Transitions
- Node transitions (5nm → 3nm → 2nm) require continuous upskilling
- Design tool changes (EDA software) increase capex needs
- Legacy project revenue could decline with technology shifts
Valuation Risk
- 86x P/E leaves limited margin for disappointment
- Profit growth moderation could trigger valuation compression
- Market premium dependent on sustained execution
Regulatory & Geopolitical Risks
US-China Semiconductor Tensions
- Export restrictions could impact partnerships
- Customer relationships with restricted nations affected
- Technology transfer regulations
Government Incentive Changes
- DLI scheme continuation uncertain
- Subsidy structure changes could alter economics
- Political policy shifts on semiconductor manufacturing
Data Security & IP Protection
- Semiconductor designs involve sensitive client IP
- Cybersecurity threats increasing
- Data localization regulations in various countries
Financial & Strategic Risks
No Dividend Policy
- Company reinvests all profits
- Limited cash returns to shareholders
- Growth-dependent investment returns
Tax Rate Normalization
- Current low tax rate may not be sustainable
- Future tax normalization could impact earnings
- Regulatory changes affecting tax structure
Working Capital Management
- Rapid scaling could stress working capital
- Customer payment terms management critical
- Inventory and supply chain complexities
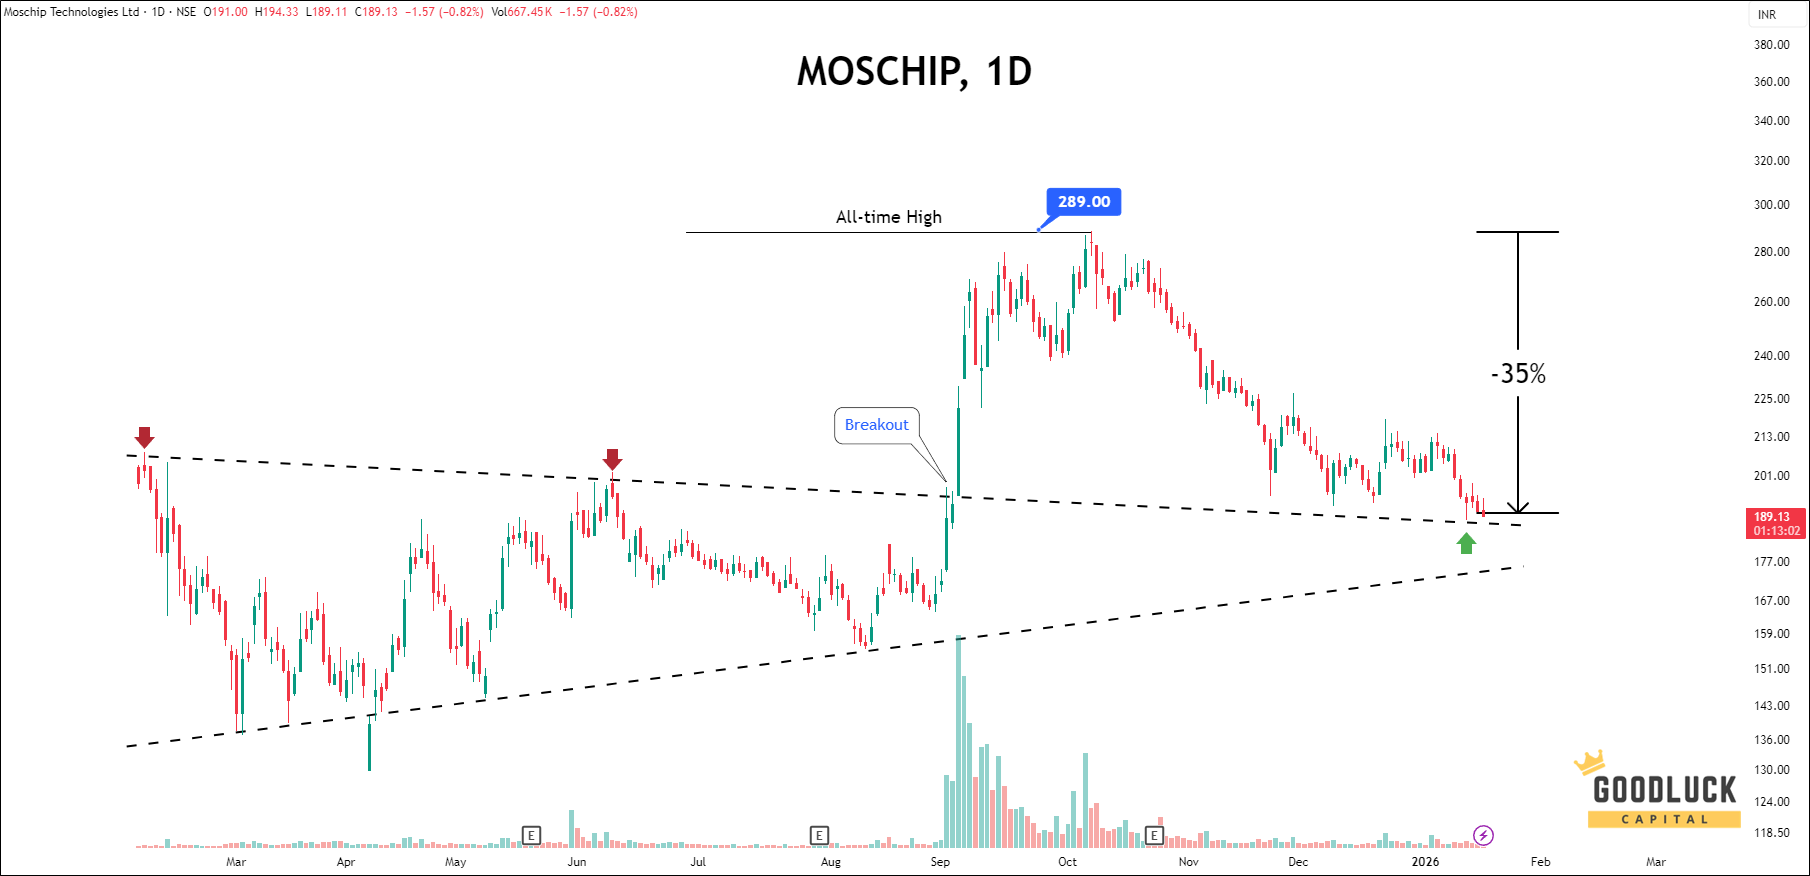
Key Observations
- After a strong breakout in September 2025, the stock rallied sharply and touched an all-time high of ₹289.
- Since then, it has seen a deep correction of nearly 35% from the peak.
- At present, the stock is trading near a critical support zone, and expectations are building that it could stabilize and resume its upward move from here.
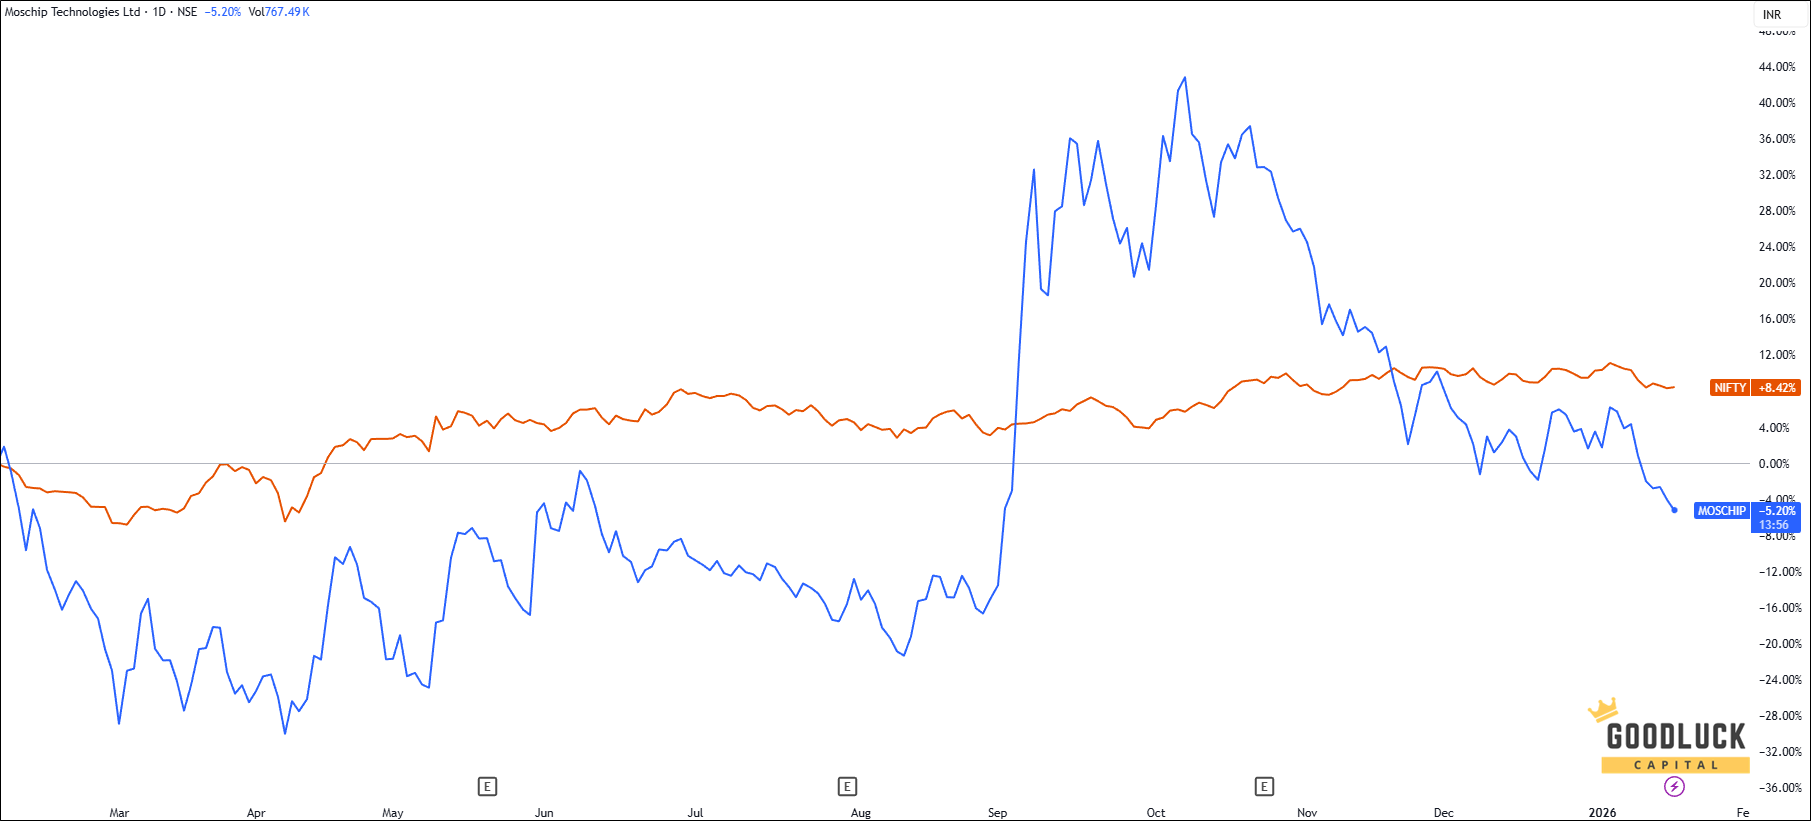
Technical Image - Daily Timeframe
Key Observations
- After a strong breakout in September 2025, the stock rallied sharply and touched an all-time high of ₹289.
- Since then, it has seen a deep correction of nearly 35% from the peak.
- At present, the stock is trading near a critical support zone, and expectations are building that it could stabilize and resume its upward move from here.
Technical Image - Daily Timeframe
Bull Case (Why to Invest)
8 Compelling Reasons for Growth Investors:
- Exceptional Profit Growth: 230% YoY net profit growth in FY25 is extraordinary
- Margin Expansion: Operating leverage driving profit growth faster than revenue
- Secular Tailwinds: AI, IoT, automotive, and 5G creating sustained demand
- Government Support: India's $100B semiconductor vision provides structural tailwinds
- Strategic Positioning: First-mover advantage in fabless semiconductor design
- Operational Excellence: Debtor days down 40%, ROE/ROCE improving
- Fortress Balance Sheet: ₹367 Cr equity with minimal debt enables growth investments
- Attractive Valuation: PEG ratio of 0.42x despite 230% growth (highly attractive)
Bear Case (Risks to Monitor)
5 Key Concerns for Conservative Investors:
- Valuation Premium: 86x P/E still elevated; limited margin for error
- Growth Sustainability: 230% profit growth unlikely to persist; normalization inevitable
- Execution at Scale: Doubling workforce (1,300 → 2,000+) poses operational risks
- Macro Sensitivity: IT capex cycles could reverse in recession
- Competition Intensifying: Established players entering semiconductor design space
Moschip Technologies is a strong growth-focused company in India’s semiconductor space. It stands to benefit from:
-
Rising demand from AI, IoT, and automotive sectors
-
Government support for semiconductor design and manufacturing
-
Growing global demand for chip design services
-
Partnerships with leading technology companies
The company’s fundamentals are solid:
-
Around 30% revenue growth
-
Very strong cash flow quality
-
Debt-free, strong balance sheet
Valuation Check:
The stock is expensive (86x P/E, ~10x P/B), meaning a lot of future growth is already priced in. Because of this, investors should keep an eye on:
-
Consistent quarterly performance
-
Improvement in profit margins
-
Dependence on a few large customers
-
Competition from bigger global players
Final View:
Best suited for growth-oriented investors with a medium-to-long-term horizon who can handle volatility. The recent consolidation after September highs could offer better entry levels.
MONEY MANAGEMENT AND TRADING RULES
Buy within the recommended price range. You may allow up to 1% flexibility beyond the range if needed.
No need to rush. The recommendation remains valid for up to 7 days, not just at market open.
Use a trailing stop-loss to protect and lock in profits.
Diversify your trading capital across our other recommended stocks to reduce risk.
Invest responsibly. Trade only with funds you can afford to lose and hedge positions where appropriate.
Analyst Summary
The research analysis is prepared by Arijit Banerjee, CMT, CFTe. He is a veteran trader and an active investor having in-depth knowledge in financial market research, advanced technical analysis, market cycle, algorithmic trading and portfolio management. Arijit is a Chartered Market Technician (CMT) accredited by CMT Association USA, the leading global authority of Technical Analysis and has been honoured by Certified Financial Technician (CFTe) from the International Federation of Technical Analysts, USA. SEBI, the regulatory body of Indian financial market also recognizes him as a Research Analyst (INH300006582).

Your Return Could be Much Better
- Swing Trading Advice
- 10—12 swing trade advice / month
- expected upside 6%—8% per trade
- short term trade holding 1-2 weeks
- minimum capital required ₹2.5 lakh
- receive trade advice before 9:00 am
- trade ideas by blackbox system, relied on statistics, technical, fundamental, macroeconomics and sentiment
- Stocks only — no intraday or F&O

Months
01
Price
₹ 6666
Months
03
20% OFF
₹ 20000
Price
₹ 15900
Months
06
35% OFF
₹ 40000
Price
₹ 25900
Months
12
50% OFF
₹ 80000
Price
₹ 39900
Months are referred as calendar months
- e.g. 12 January — 12 April (3 Months)
- 20 June — 20 December (6 Months)
Looking for more information?
Looking for more information?
Swing Trade Advice Benefits
- ideal for short term positional traders
- receive trading advice via Whatsapp
- precise Entry, Target and StopLoss
- preferred largecap & midcap stocks
- revised targets & stoploss if required
- alert message for target or stoploss hit
Swing Trade Advice Samples
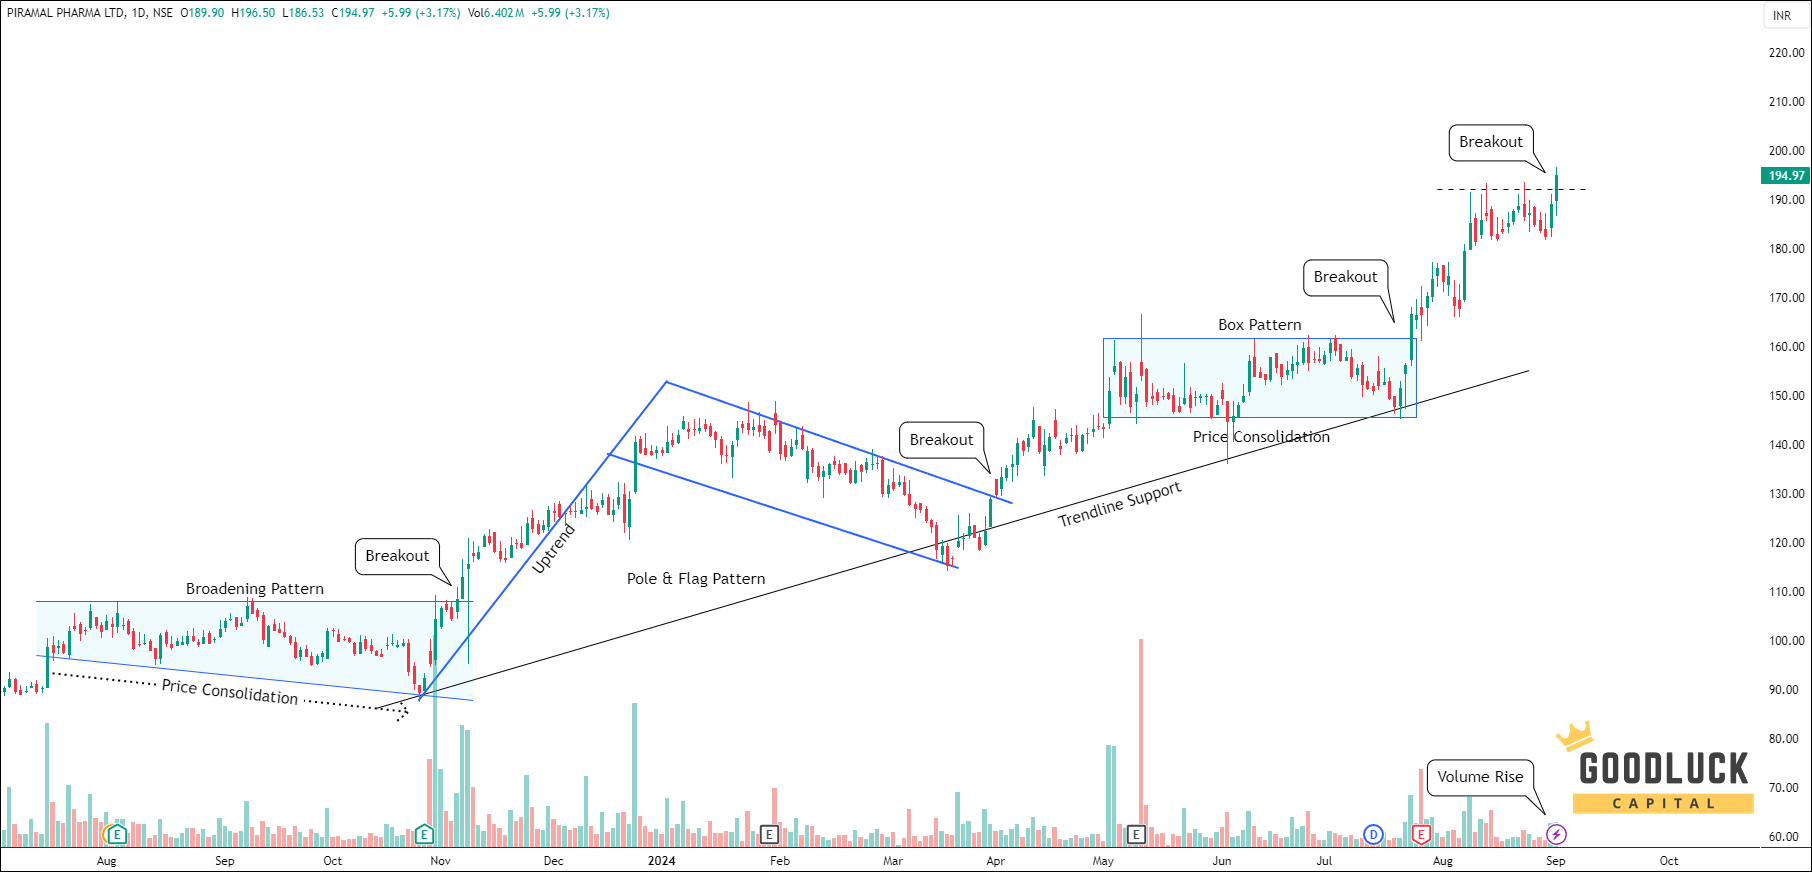
-
Buy Piramal Pharma
nse: pplpharma
- Best Buy Range
- Sell Target
- StopLoss
- Potential Upside
- Approx Trade Duration
- : 190 - 194
- : 204 - 207
- : below 180
- : 7% - 8%
- : 12-14 days
-
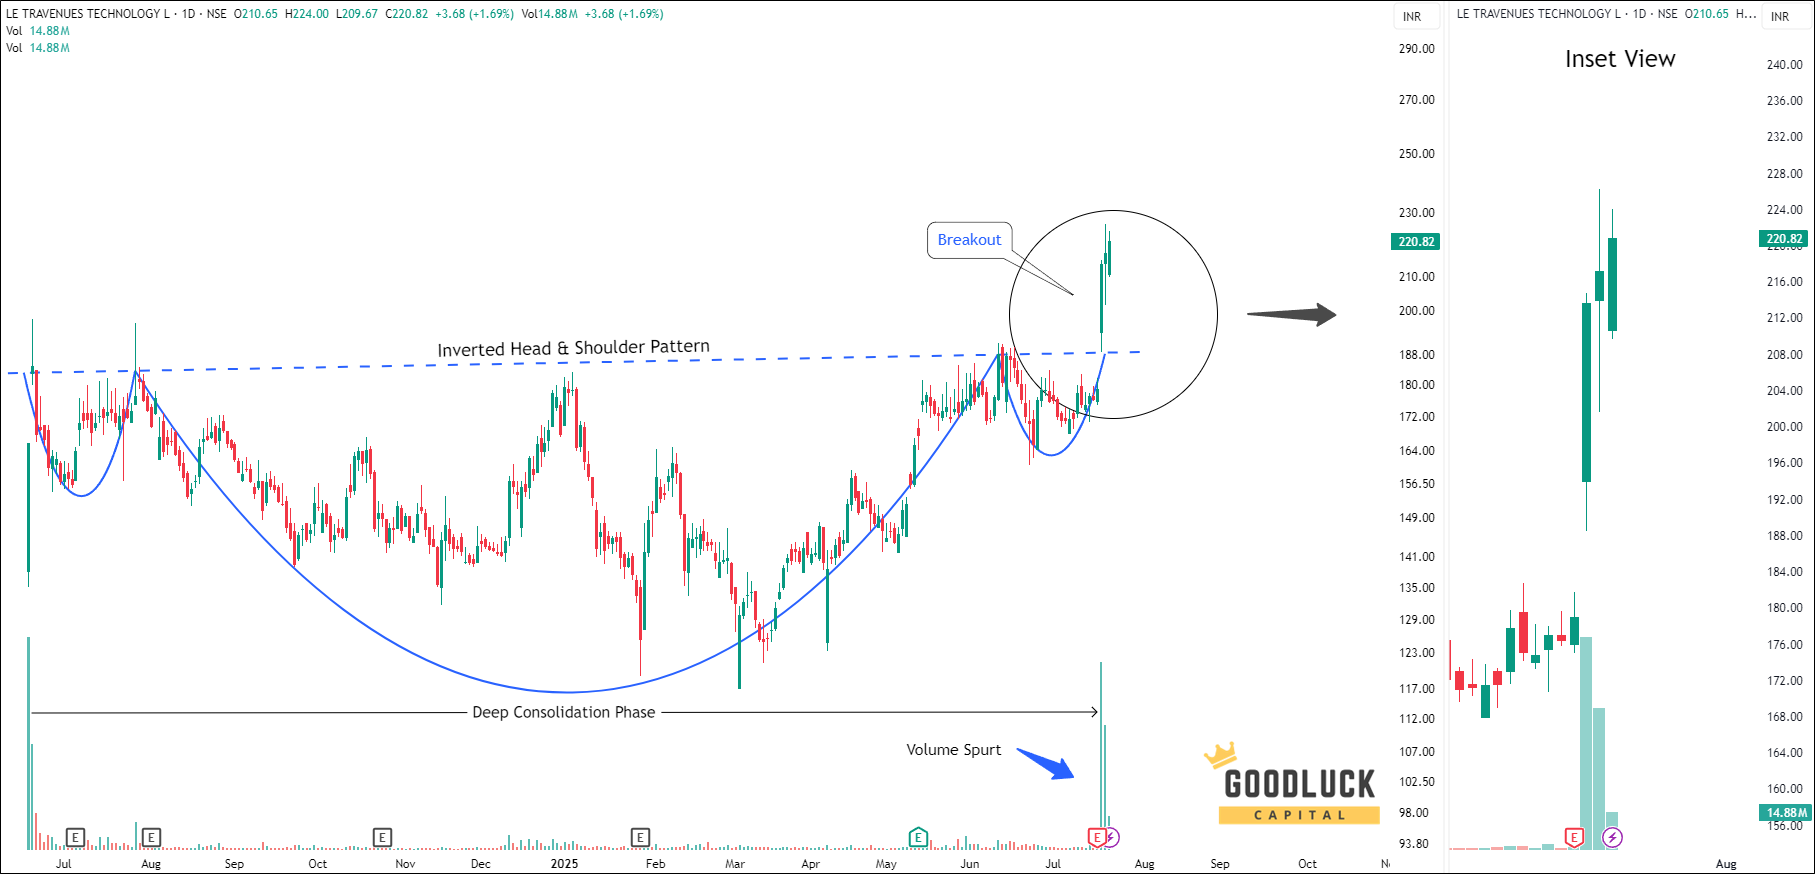
Buy Le Travenues Technology
nse: ixigo
- Best Buy Range
- Sell Target
- StopLoss
- Potential Upside
- Approx Trade Duration
- : 215 - 220
- : 240 - 240
- : below 195
- : 10% - 13%
- : 14-15 days
-
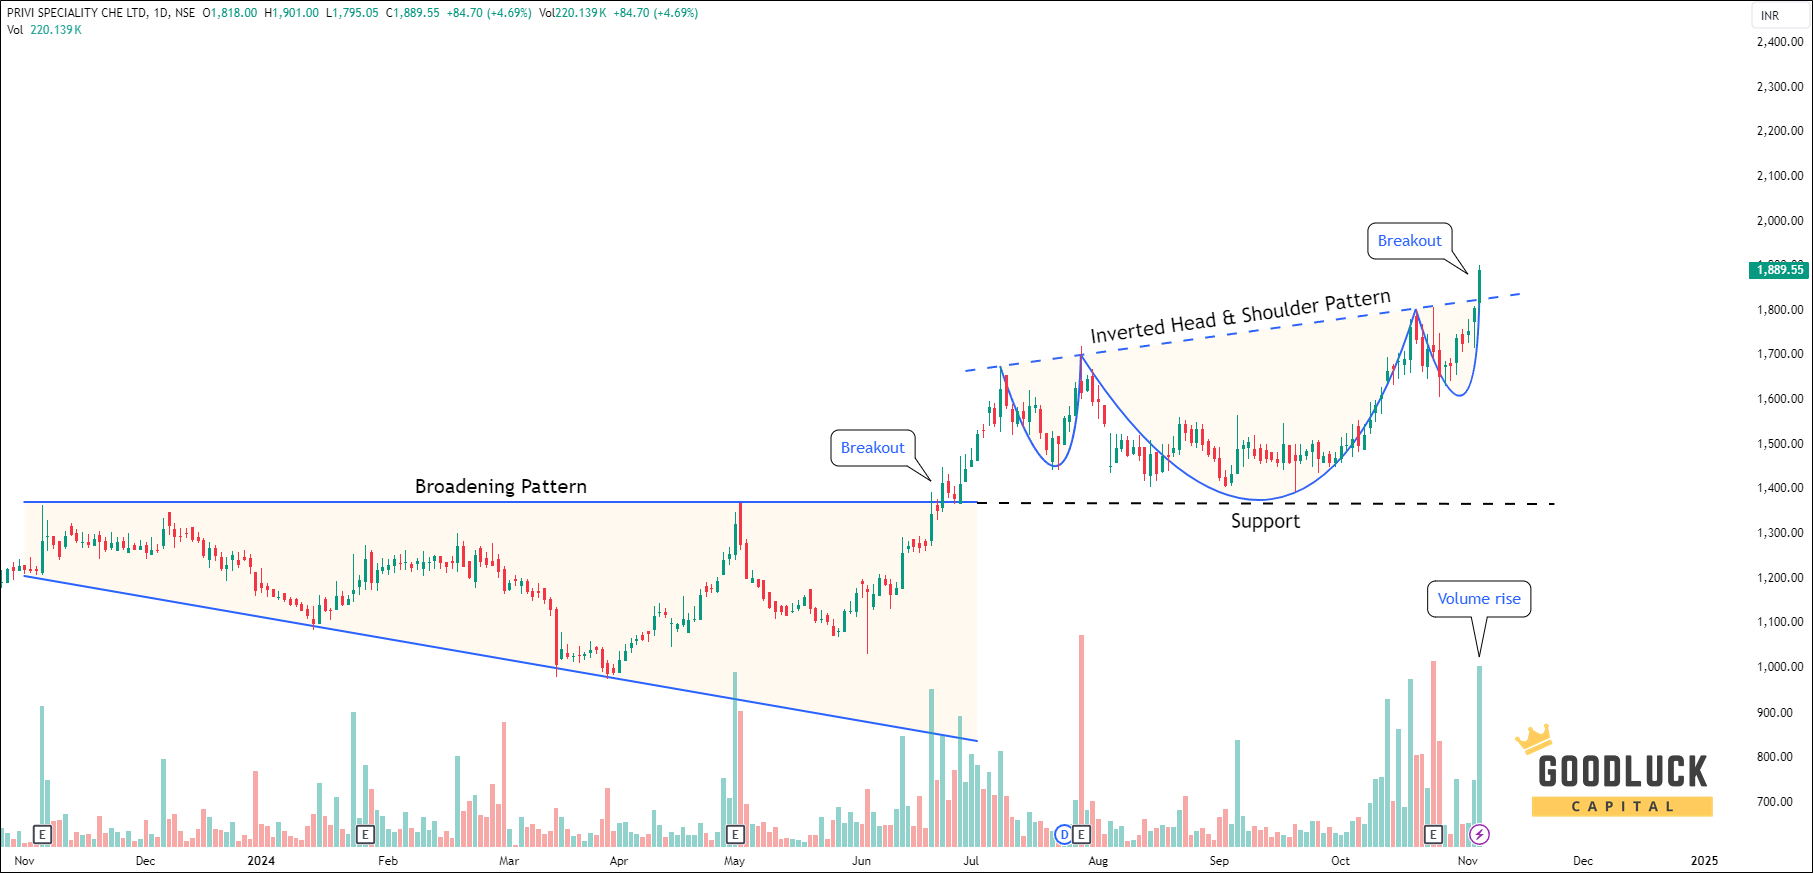
Buy Privi Speciality Chemicals
nse: priviscl
- Best Buy Range
- Sell Target
- StopLoss
- Potential Upside
- Approx Trade Duration
- : 1845 - 1875
- : 1975 - 2000
- : below 1770
- : 6% - 8%
- : 12-14 days
-
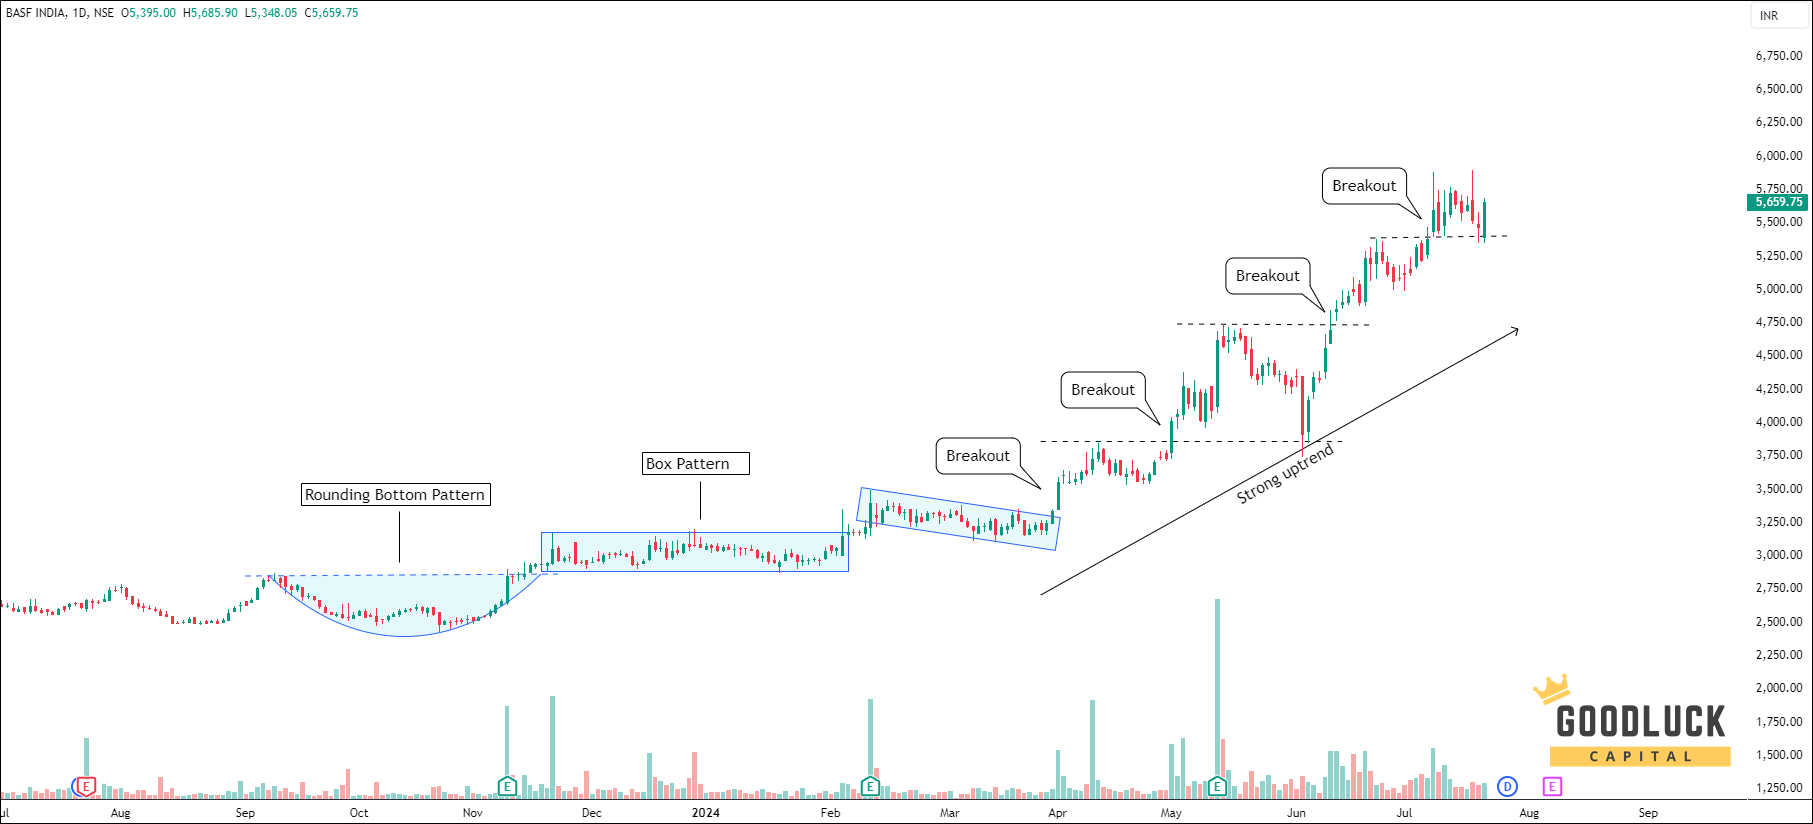
Buy BASF India
nse: basf
- Best Buy Range
- Sell Target
- StopLoss
- Potential Upside
- Approx Trade Duration
- : 5450 - 5600
- : 6050 - 6200
- : below 5200
- : 10% - 12%
- : 12-14 days
-
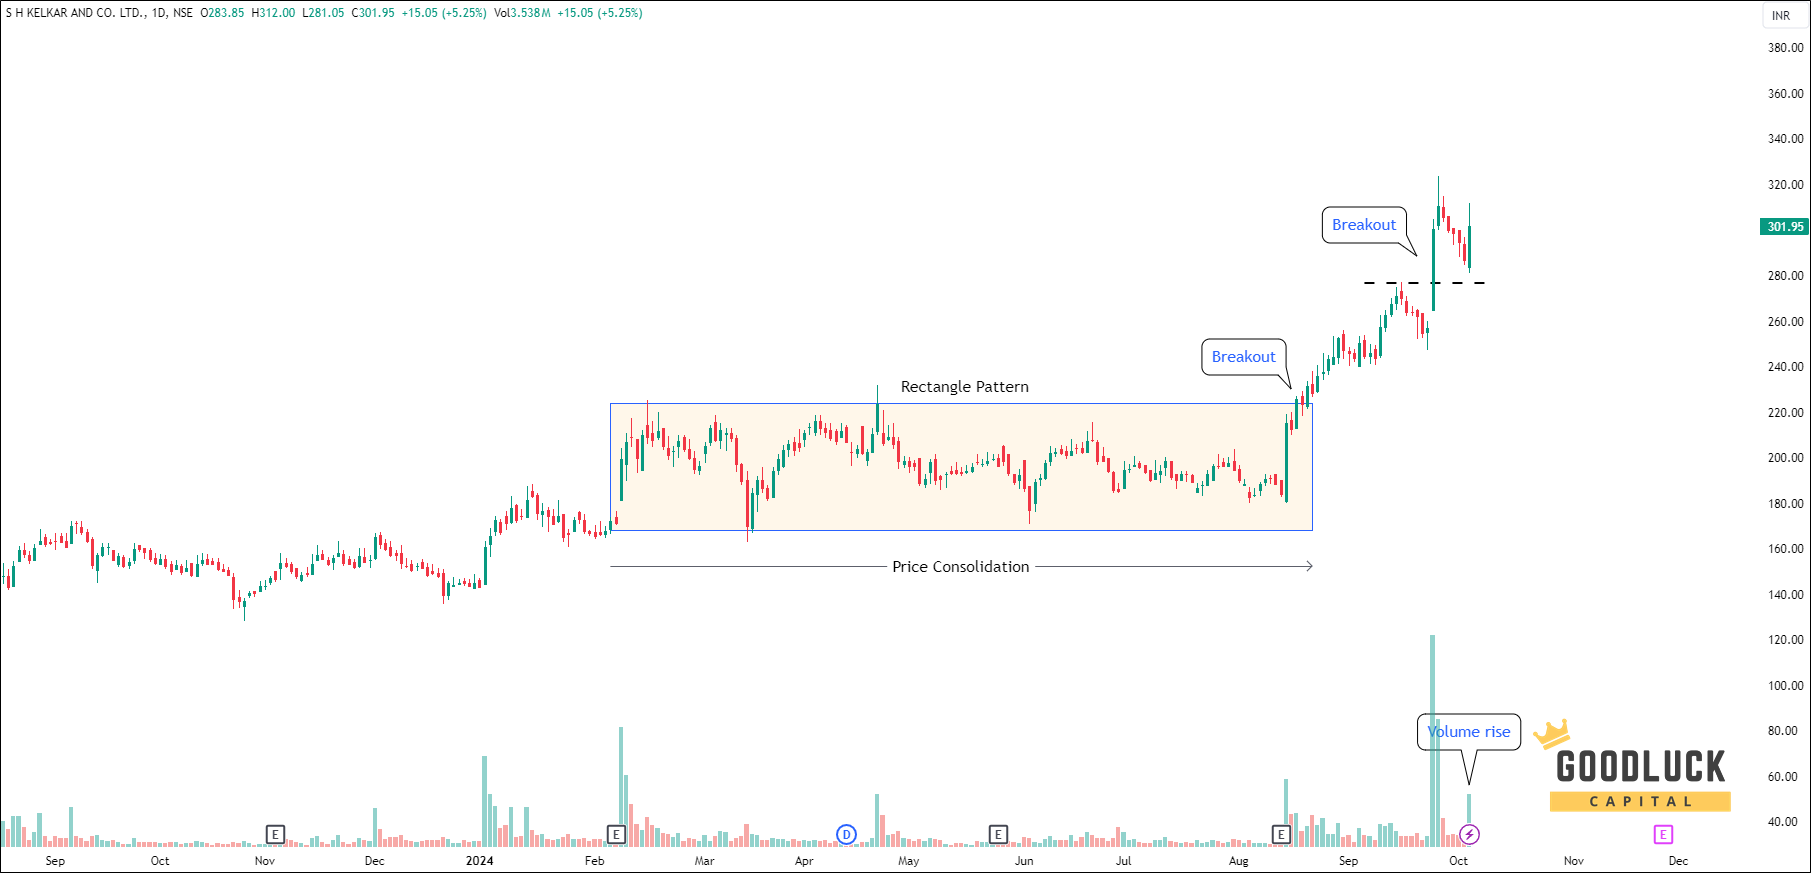
Buy S H Kelkar
nse: shk
- Best Buy Range
- Sell Target
- StopLoss
- Potential Upside
- Approx Trade Duration
- : 285 - 300
- : 330 - 340
- : below 270
- : 13% - 16%
- : 14-15 days
More Trading & Investment Advice


- Premium (unlocked)
- March 24, 2026

- Premium (unlocked)
- March 17, 2026

- Premium
- March 17, 2026

- Premium (unlocked)
- March 17, 2026