StopLoss*: Apply on the daily close. After the first target, reset the StopLoss to your buying price.
Duration^: Approximate holding period based on the active trading days (excluding market holidays). Actual holding may vary with the market conditions.
Upside Potential#: Based on median of the suggested buy range.
Tech Mahindra Limited, founded in 1986 and headquartered in Pune, India, is a global IT services company providing information technology and business process solutions across the Americas, Europe, India, and other international markets, offering services such as application development, cloud computing, artificial intelligence, data analytics, cybersecurity, automation, and network services, while also delivering business process outsourcing, customer support, finance and accounting, and digital transformation solutions to industries including banking, telecom, healthcare, manufacturing, retail, energy, media, travel, and insurance.
Revenue Growth: HCLTech reported revenue of ₹33,872 crore, up 13.3% YoY, showing steady demand for its IT services and helping the company cross the $15 billion annualized revenue milestone.
Profit Impact: Net profit declined 11% YoY to ₹4,076 crore mainly due to a one-time ₹956 crore expense related to new labour laws; excluding this exceptional cost, profits would have increased.
Margins Improving: EBIT margin rose to 18.6%, indicating better cost management and recovery from margin pressure seen in earlier quarters.
Strong Deal Wins: The company secured $3 billion worth of new deals, up 43.5% YoY, driven by strong client spending on AI and cloud transformation.
Positive Outlook: Management raised FY26 revenue growth guidance to 4–4.5% and announced a ₹12 dividend, underlining confidence in business stability and cash flows.
Financial Highlights
Metric
Q3 FY26
Q2 FY26
Q3 FY25
QoQ Growth (%)
YoY Growth (%)
Revenue from Operations (₹ Crore)
33,872
31,942
29,890
6
13.3
Net Profit - PAT (₹ Crore)
4,076
4,236
4,591
-3.8
-11.2
Net Profit - Adjusted (₹ Crore)*
4,795
4,236
4,591
13.2
4.5
EBIT (₹ Crore)
6,285
5,549
5,823
13.2
8
EBIT Margin (%)
18.6
17.37
19.47
+123 bps
-87 bps
EPS - Basic (₹)
15.06
15.63
16.95
-3.6
-11.1
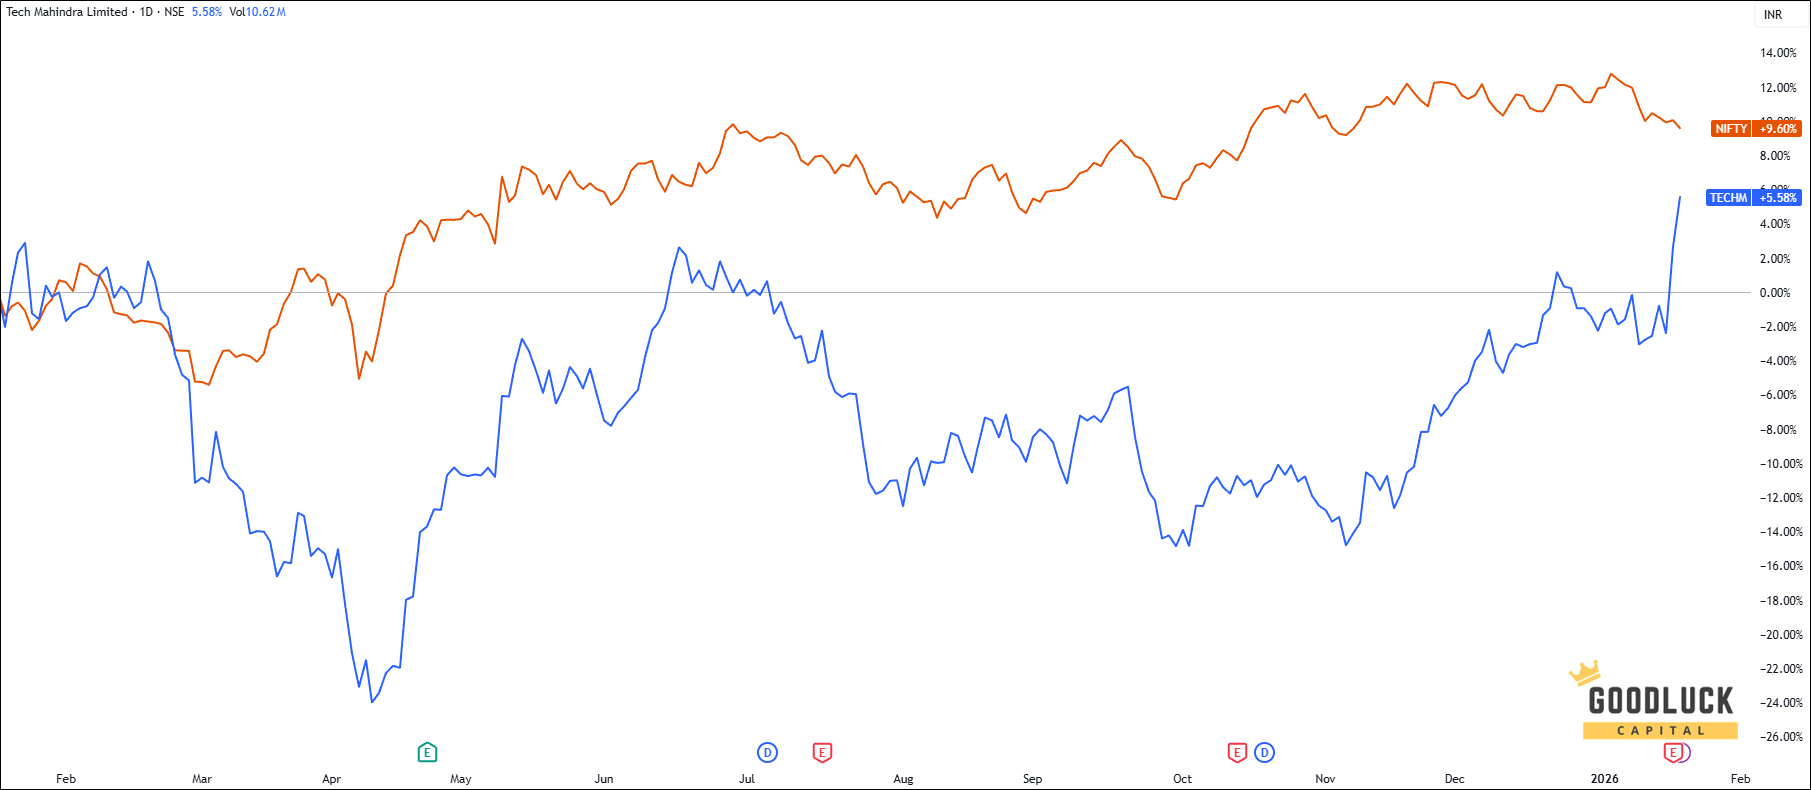
Price Performance & Volume Analysis
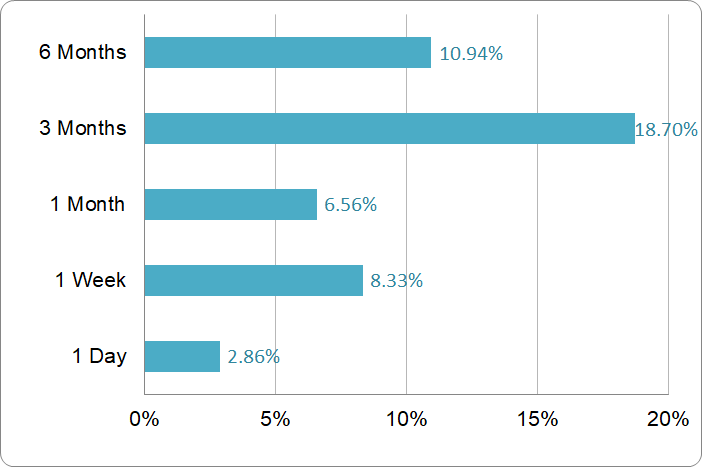
Price Performance
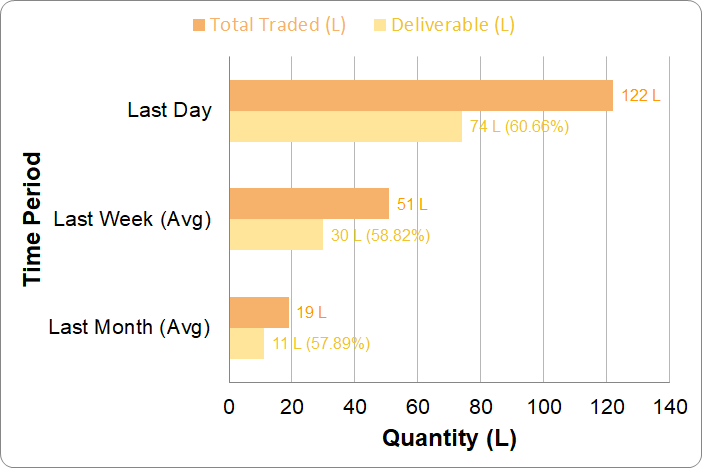
Volume Analysis
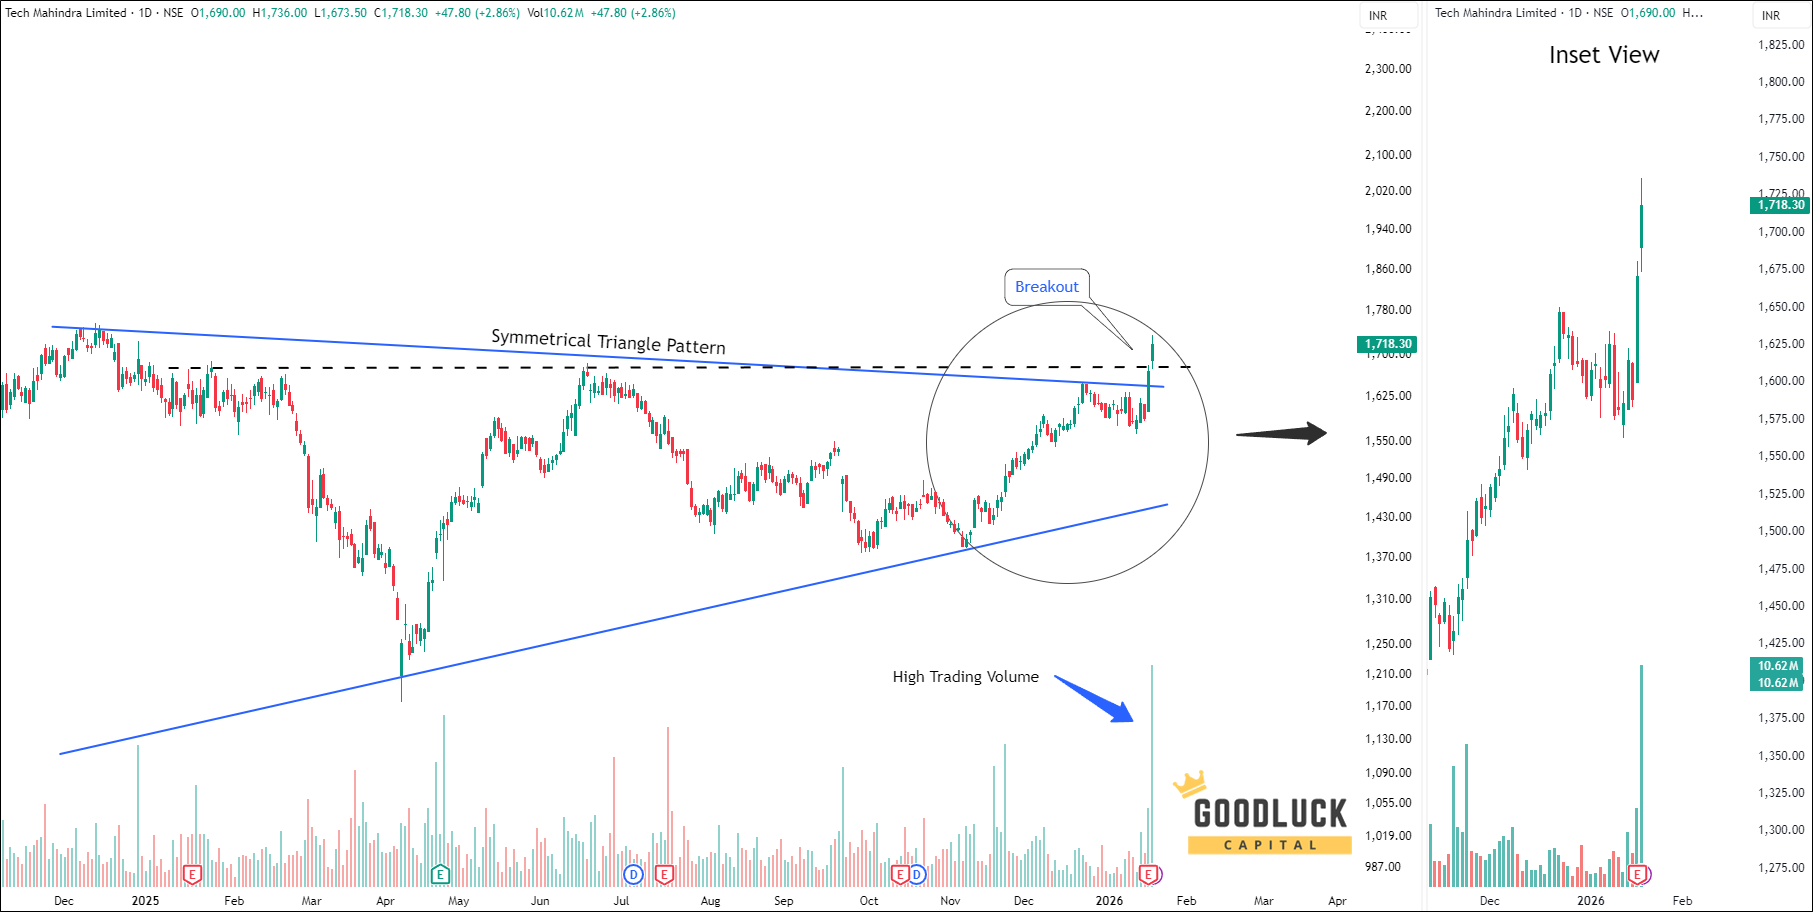
Technical Analysis
Key Observations
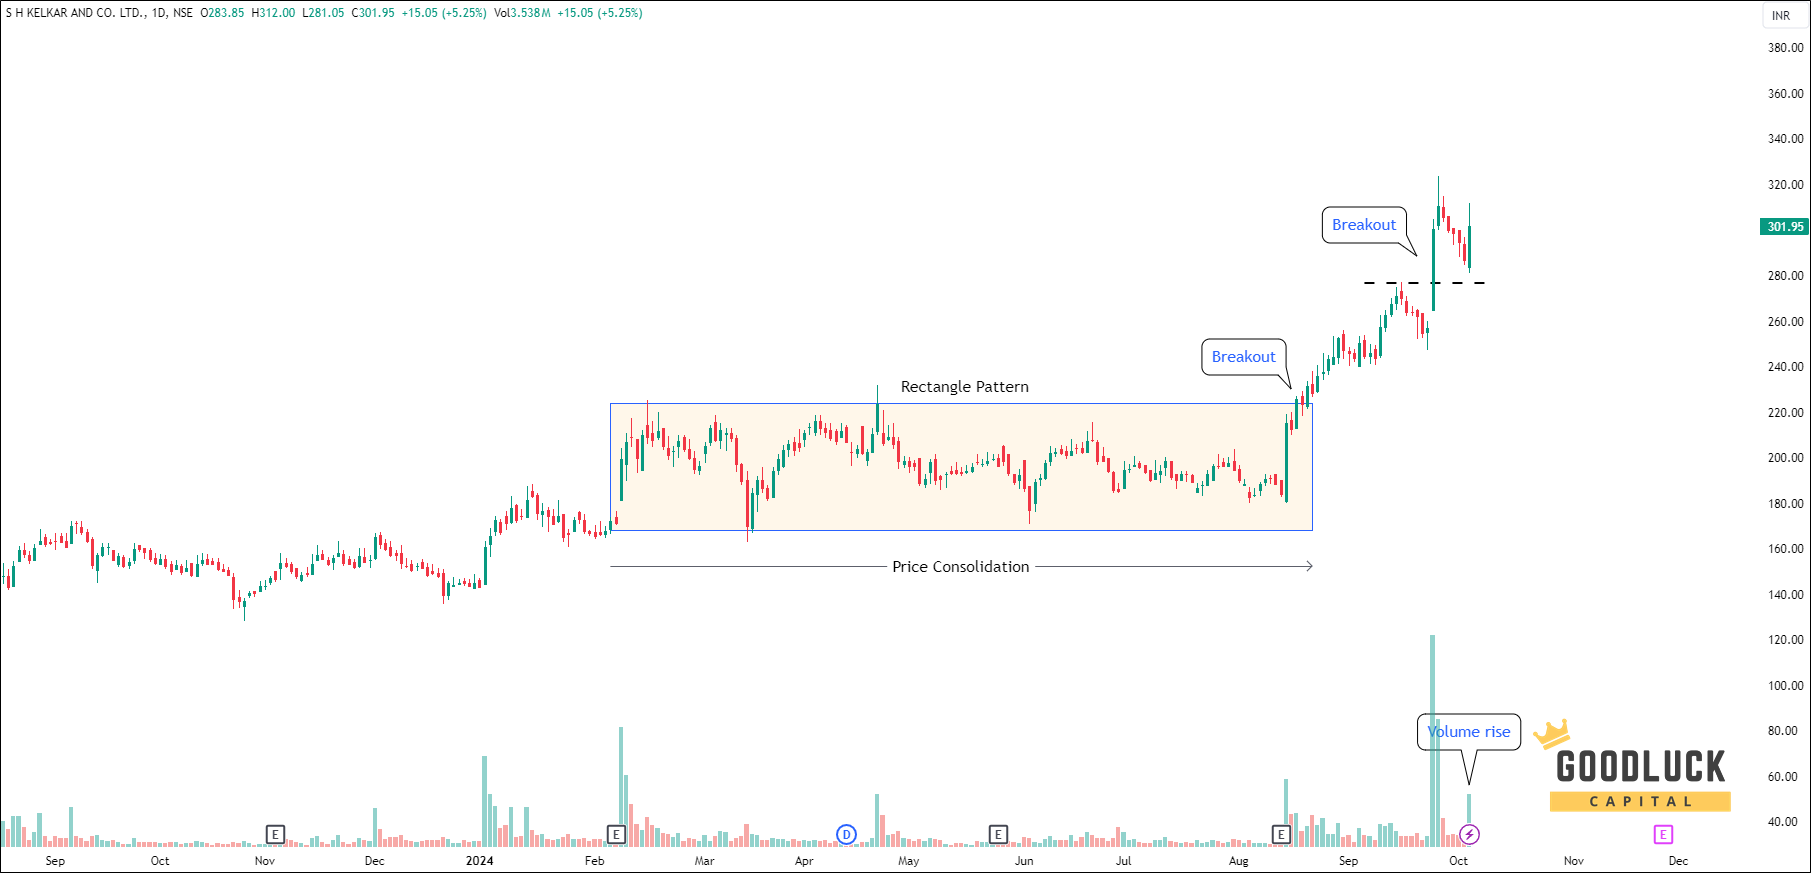
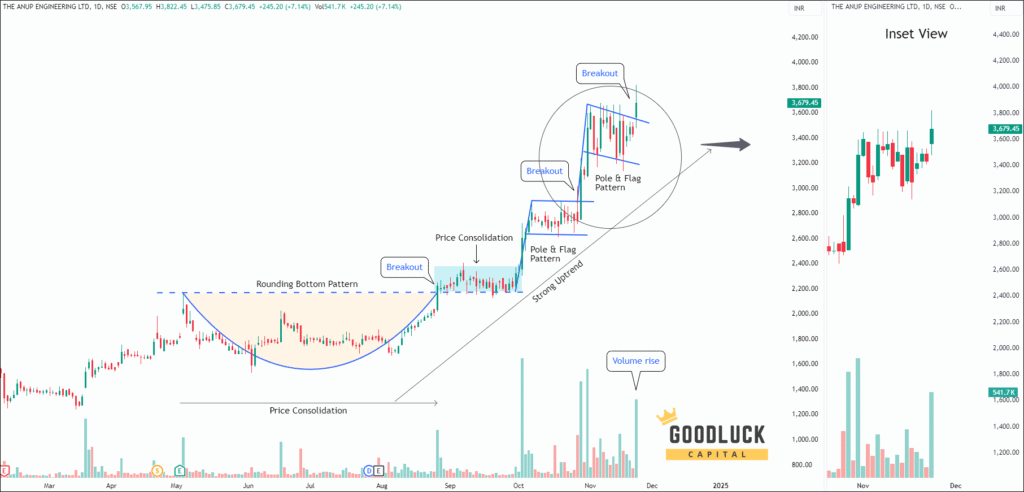
The stock has broken out of a symmetrical triangle pattern with strong volume, indicating a clear bullish breakout.
This reflects strong buying interest, suggesting potential further upside in the near term.
With the right swing trading stock picks, even a small price swing can turn into a sharp, profitable rally.
Technical Image - Daily Timeframe
Technical Indicators
Oscillators
Indicator
Value
Zone
RSI-14
70.45
Overbought
CCI-14
330.06
Overbought
MFI
70.18
Neutral
ROC
8.01
Positive
Stochastic %K
72.43
Neutral
William %R
-10.22
Overbought
Exponential Moving Averages (EMAs)
EMA
Value
Stock Position
5 EMA
1651
Above
10 EMA
1631
Above
20 EMA
1611
Above
50 EMA
1569
Above
100 EMA
1540
Above
200 EMA
1540
Above
Conclusion
Tech Mahindra Stock Price Forecast
Based on our best stock advisor in India, the Tech Mahindra Stock Price target will be INR 1760 - INR 1780 in the next 12-14 trading sessions.
MONEY MANAGEMENT AND TRADING RULES
Buy within the recommended price range. You may allow up to 1% flexibility beyond the range if needed.
No need to rush. The recommendation remains valid for up to 7 days, not just at market open.
Use a trailing stop-loss to protect and lock in profits.
Diversify your trading capital across our other recommended stocks to reduce risk.
Invest responsibly. Trade only with funds you can afford to lose and hedge positions where appropriate.
Analyst Summary
The research analysis is prepared by Arijit Banerjee, CMT, CFTe. He is a veteran trader and an active investor having in-depth knowledge in financial market research, advanced technical analysis, market cycle, algorithmic trading and portfolio management. Arijit is a Chartered Market Technician (CMT) accredited by CMT Association USA, the leading global authority of Technical Analysis and has been honoured by Certified Financial Technician (CFTe) from the International Federation of Technical Analysts, USA. SEBI, the regulatory body of Indian financial market also recognizes him as a Research Analyst (INH300006582).
The views expressed herein are based solely on information available publicly/internal data/other sources believed to be reliable, but is not necessarily all-inclusive and is not guaranteed as to accuracy. The recommendations provided herein is solely for informational purposes and are not intended to be and must not be taken alone as the basis for an investment/trading decision. Trading and investing are subject to market risk and the securities discussed and opinions expressed herein may not be suitable for all investors. To read the full disclosure, please click here.
Your Return Could be Much Better
Increase your Profitable!
Swing Trading Advice
10—12 swing trade advice / month
expected upside 6%—8% per trade
short term trade holding 1-2 weeks
minimum capital required ₹2.5 lakh
receive trade advice before 9:00 am
trade ideas by blackbox system, relied on statistics, technical, fundamental, macroeconomics and sentiment