StopLoss*: Apply on the daily close. After the first target, reset the StopLoss to your buying price.
Duration^: Approximate holding period based on the active trading days (excluding market holidays). Actual holding may vary with the market conditions.
Upside Potential#: Based on median of the suggested buy range.
Krishna Institute of Medical Sciences Limited (KIMS Hospitals) is a leading healthcare company in India. It provides a wide range of medical services including cardiology, neurology, oncology, orthopedics, transplants, pediatrics, and critical care.
Founded in 1973 and headquartered in Secunderabad, KIMS operates multi-specialty hospitals offering advanced treatments and diagnostic services across various medical fields.
KIMS delivered its highest ever quarterly revenue, crossing about ₹1,000 crore, with around 29% growth versus last year and about 4% growth versus last quarter, driven by strong patient volumes and new hospitals.
EBITDA stayed broadly flat in value terms and margins fell to about 20–21%, mainly because new hospitals in Maharashtra and Karnataka are still in the loss‑making ramp‑up phase.
Net profit dropped sharply (around 40–45% YoY and meaningfully QoQ), as higher depreciation and interest from recent expansions, plus initial losses at new units, more than offset the strong revenue growth.
Operating metrics were very healthy, with double‑digit growth in in‑patients and out‑patients and a strong jump in average revenue per bed and per patient, helped by more complex procedures and richer case mix.
Management said they are comfortable with near‑term margin pressure while they scale up new hospitals, and they expect these units to reach EBITDA break‑even over the next few quarters, supporting better profitability in FY27.
Financial Highlights
Metric
Q3 FY26
Q2 FY26*
Q3 FY25
QoQ change (Q3 vs Q2)
YoY change (Q3 vs Q3)
Operating revenue
997.70
960.00
772.40
3.90%
29.20%
Total revenue
1,002.90
965.00
790.00
3.90%
26.90%
EBITDA
204.10
208.30
205.00
-2.00%
-0.40%
EBITDA margin (%)
20.40
21.60
25.90
-120 bps
-550 bps
Profit after tax (PAT)
51.90
72.00
93.00
-27.90%
-44.20%
PAT margin (%)
5.20
7.50
11.90
-230 bps
-670 bps
EPS (₹)
1.30
1.60
2.20
-20.10%
-39.90%
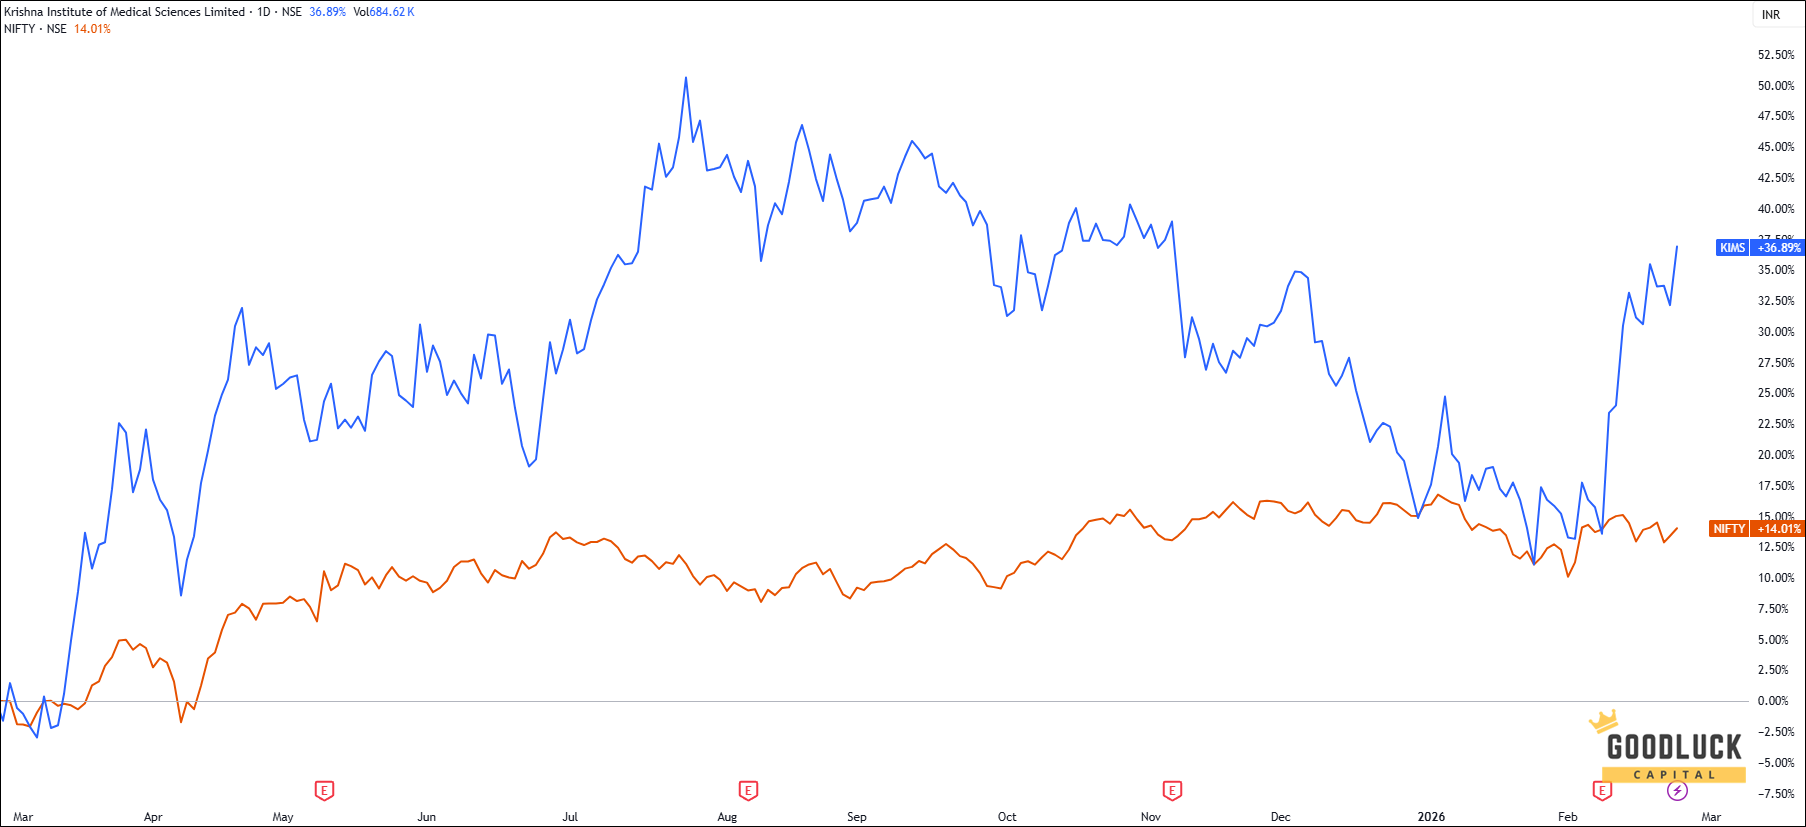
Price Performance & Volume Analysis
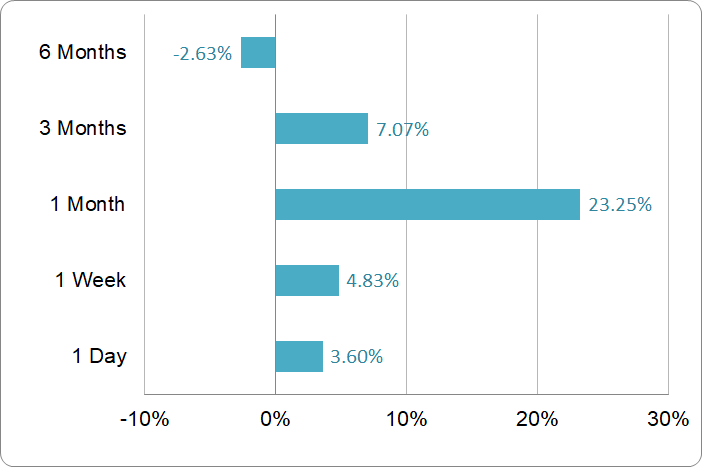
Price Performance
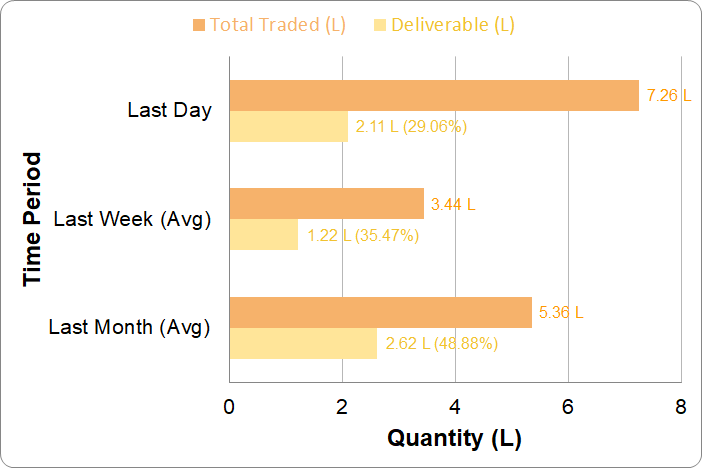
Volume Analysis
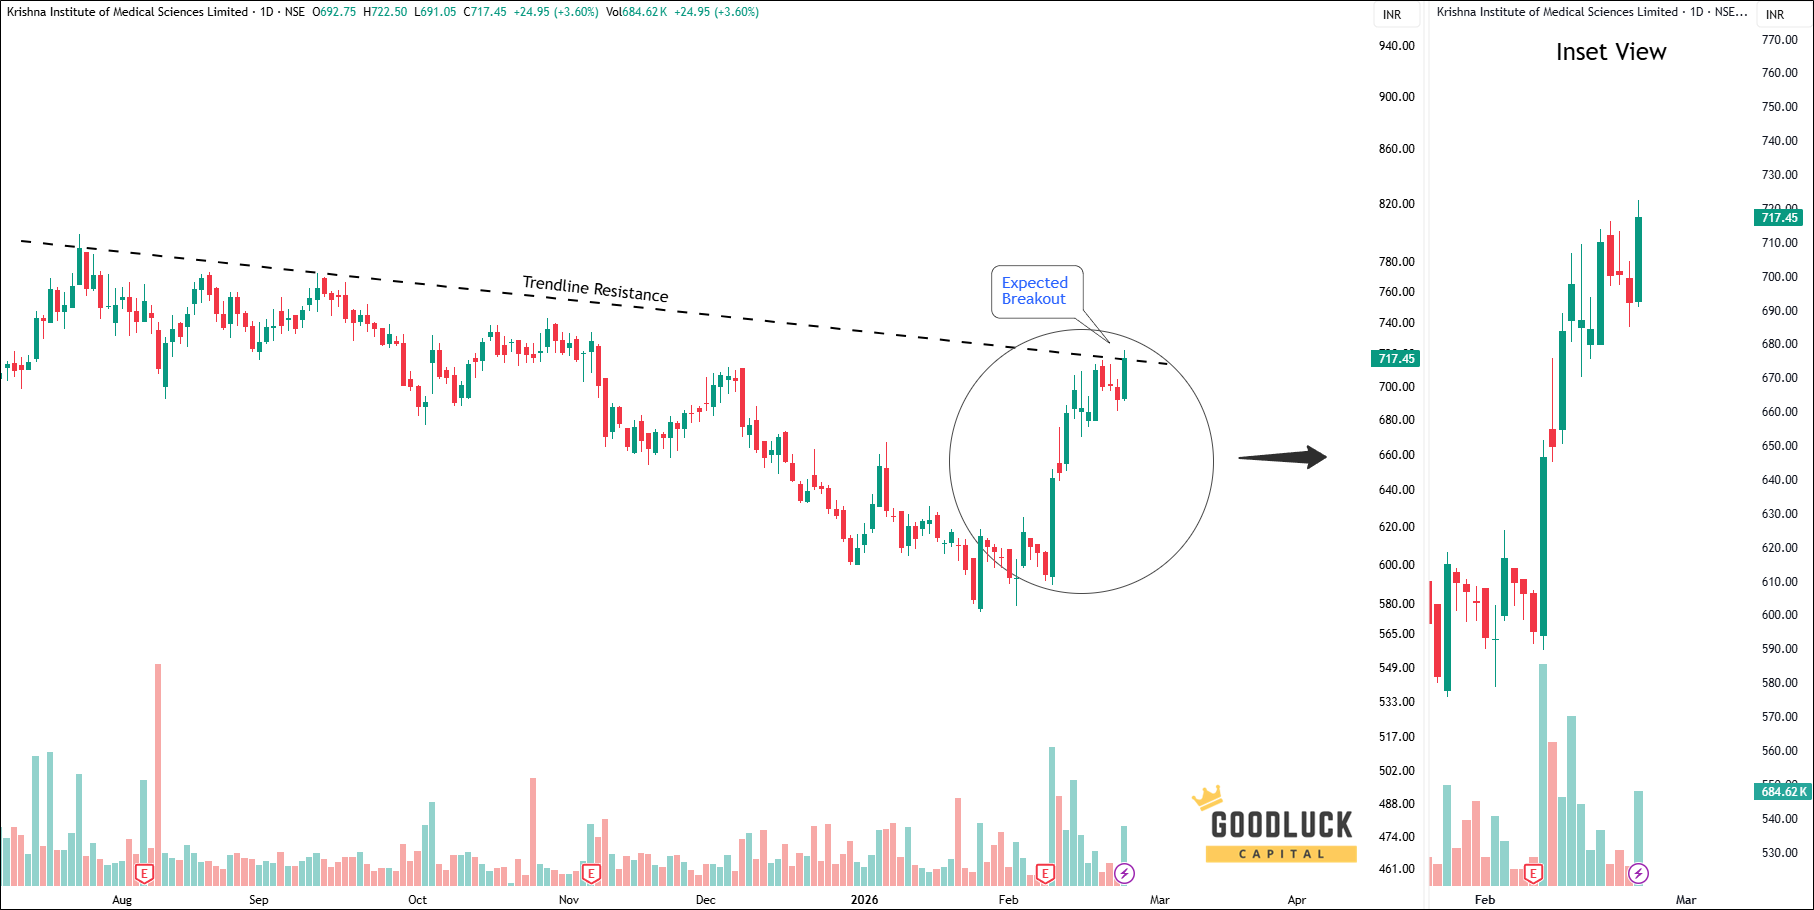
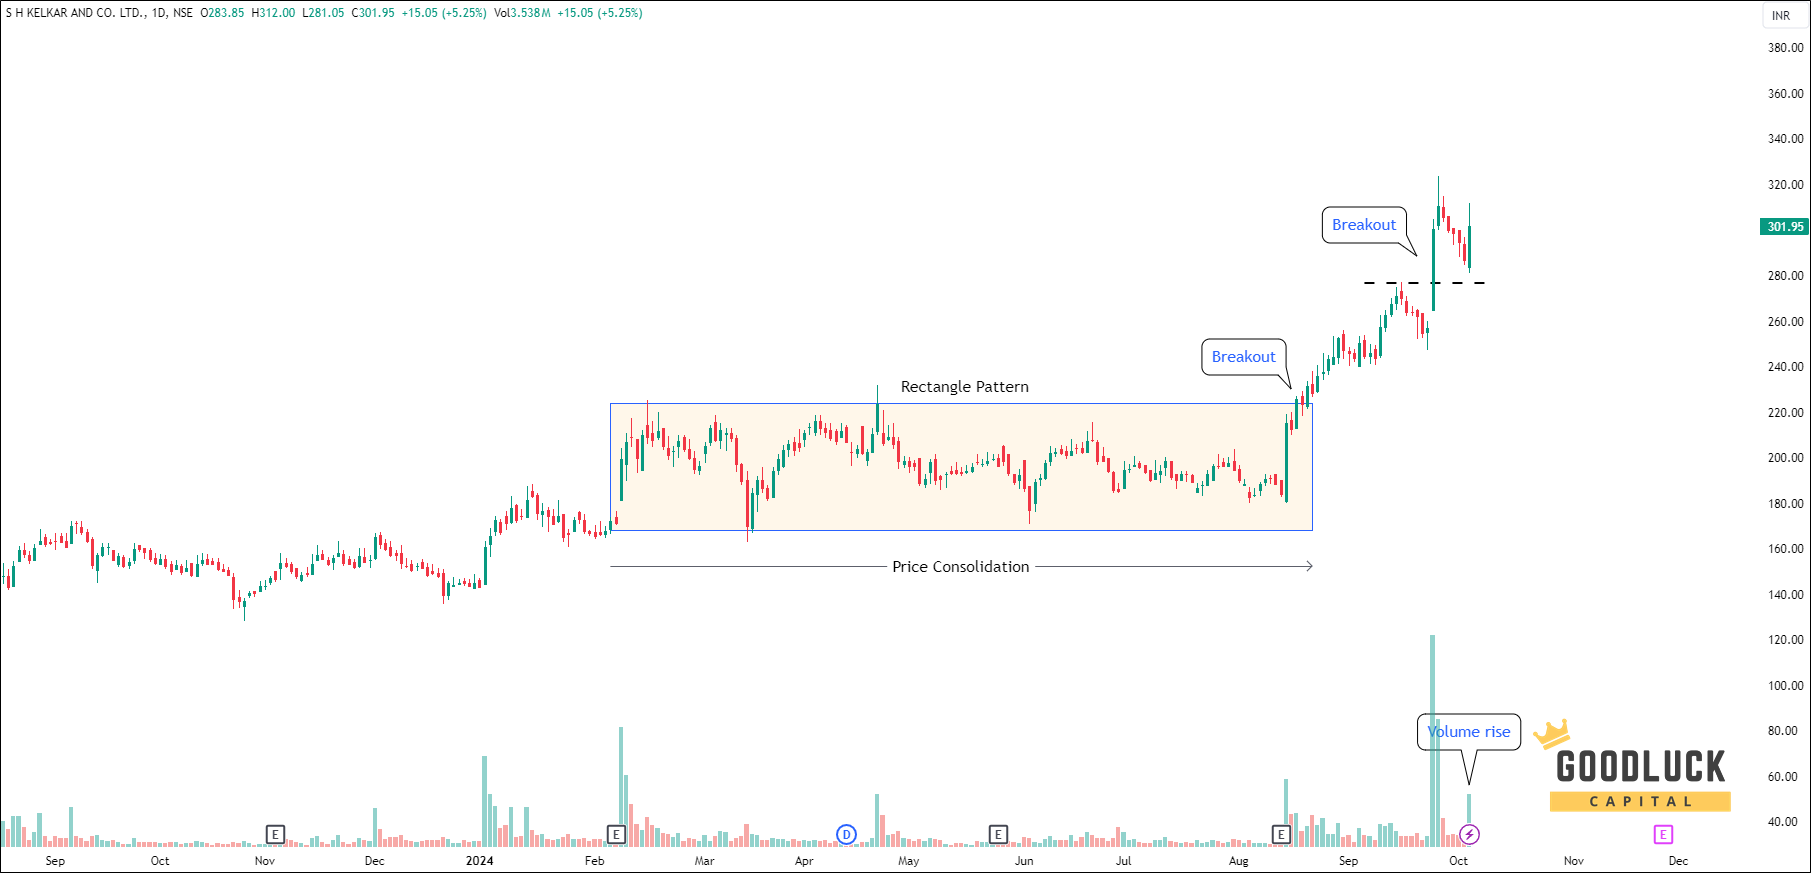
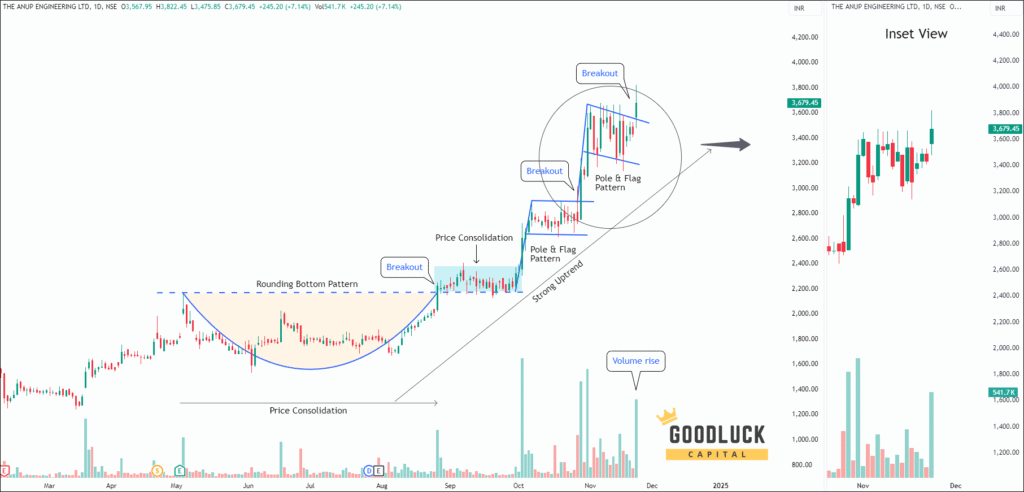
Technical Analysis
Key Observations
The stock has tested the trendline resistance multiple times in the past and has once again approached the same level.
A breakout is highly anticipated at this time, which could potentially trigger a short-term upside move.
Krishna Institute of Medical Sciences Stock Price Forecast
Based on our positional calls Indian stock market, the Krishna Institute of Medical Sciences stock price target will be INR 740 - INR 750 in the next 12-14 trading sessions.
MONEY MANAGEMENT AND TRADING RULES
Buy within the recommended price range. You may allow up to 1% flexibility beyond the range if needed.
No need to rush. The recommendation remains valid for up to 7 days, not just at market open.
Use a trailing stop-loss to protect and lock in profits.
Diversify your trading capital across our other recommended stocks to reduce risk.
Invest responsibly. Trade only with funds you can afford to lose and hedge positions where appropriate.
Analyst Summary
The research analysis is prepared by Arijit Banerjee, CMT, CFTe. He is a veteran trader and an active investor having in-depth knowledge in financial market research, advanced technical analysis, market cycle, algorithmic trading and portfolio management. Arijit is a Chartered Market Technician (CMT) accredited by CMT Association USA, the leading global authority of Technical Analysis and has been honoured by Certified Financial Technician (CFTe) from the International Federation of Technical Analysts, USA. SEBI, the regulatory body of Indian financial market also recognizes him as a Research Analyst (INH300006582).
The views expressed herein are based solely on information available publicly/internal data/other sources believed to be reliable, but is not necessarily all-inclusive and is not guaranteed as to accuracy. The recommendations provided herein is solely for informational purposes and are not intended to be and must not be taken alone as the basis for an investment/trading decision. Trading and investing are subject to market risk and the securities discussed and opinions expressed herein may not be suitable for all investors. To read the full disclosure, please click here.
Your Return Could be Much Better
Increase your Profitable!
Swing Trading Advice
10—12 swing trade advice / month
expected upside 6%—8% per trade
short term trade holding 1-2 weeks
minimum capital required ₹2.5 lakh
receive trade advice before 9:00 am
trade ideas by blackbox system, relied on statistics, technical, fundamental, macroeconomics and sentiment