In the final week of December and the opening days of January, Indian stock markets often slip into a curious yet powerful seasonal trend known as the Santa Claus Rally. It’s a short window where optimism tends to outweigh caution, prices often drift higher, and small-cap stocks, in particular, have historically delivered eye-catching returns. Over the past decade, small-caps have gained during this festive period every single year, with average returns of 3.55%—a record that’s hard to ignore.
For market participants focused on swing trading advice in India, this phase becomes especially interesting, as short-term price momentum often accelerates due to lighter volumes and improving sentiment.
This seasonal surge is fueled by a mix of year-end portfolio reshuffling, lighter trading volumes, and a noticeable improvement in market sentiment. For investors who understand the rhythm of the market, it often turns into a season of opportunity.
What Is the Santa Claus Rally, Really?
Imagine this scene: shopping malls echo with Christmas music, families plan New Year celebrations, and while most people slow down for the holidays, markets quietly gear up for a potential move. The Santa Claus Rally refers to a recurring market pattern where stocks tend to rise during the last five trading days of December and the first two trading days of January.
Though the term originated in Western markets, it’s far from being a Wall Street-only phenomenon. Indian stock markets have shown their own version of Santa’s generosity, often rewarding investors during this brief yet impactful phase. As benchmarks like the Nifty and Sensex approach year-end, anticipation naturally builds around whether history will repeat itself.
The name itself adds charm to the concept, suggesting that Santa doesn’t just deliver gifts under Christmas trees but also sneaks gains into investor portfolios. And unlike many market myths, this one is backed by data more often than not.
Market optimism tends to peak as the calendar flips toward January, and investors begin positioning themselves for a potential year-end lift. This hope isn’t blind faith—it’s rooted in historical behavior that has played out repeatedly.
What the Data Says: A Decade of Festive Market Performance
When it comes to seasonal patterns, numbers matter. Research from SAMCO Securities, which analyzed Indian market performance over the past ten Santa Rally periods, paints a compelling picture.
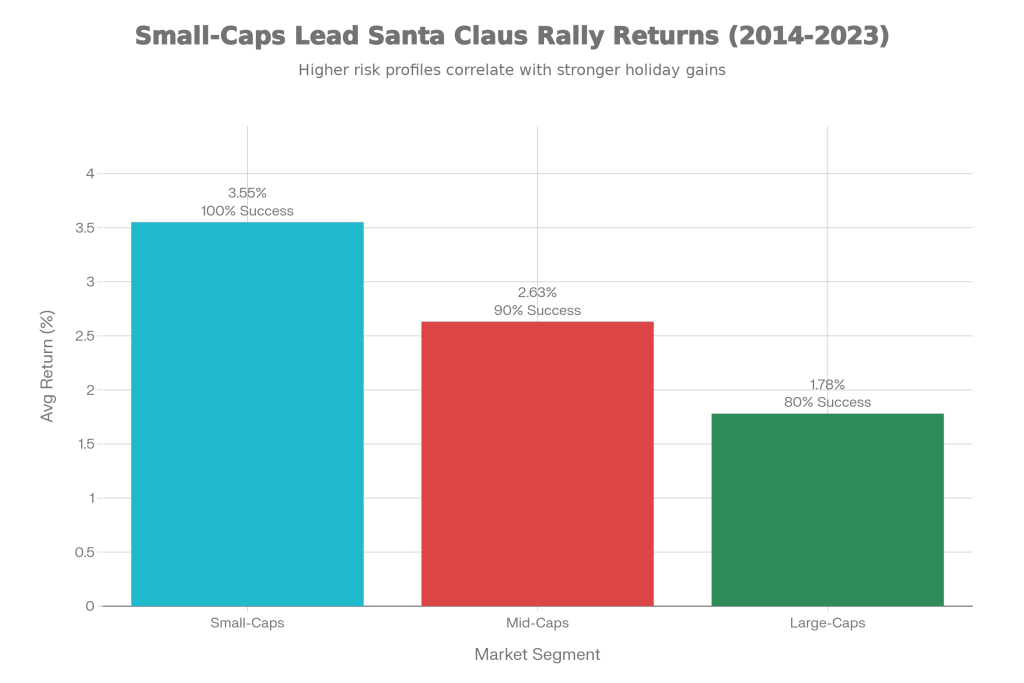
Small-cap stocks have emerged as the clear winners. With an average return of 3.55% and a 100% success rate, meaning gains in all ten years, small-caps have earned the reputation of being Santa’s most reliable gift. Mid-cap stocks have also delivered consistently, offering average returns of 2.63% and positive performance in nine out of ten years.
Large-cap stocks, represented by the Nifty 100, haven’t lagged entirely either. They’ve produced steadier gains of around 1.78%, with an 80% success rate. While the upside is more modest, the lower volatility appeals to conservative investors.
Looking at the broader picture, the Nifty 50 has ended December on a positive note in 17 of the last 24 years, translating to a 71% probability of gains for the month. January often continues this momentum, with average returns close to 1.49%, suggesting the festive cheer doesn’t disappear overnight.
Why December Feels Different in the Markets
December stands apart from other months due to a unique combination of behavioural and structural factors. Institutional investors rebalance portfolios before the year ends, which can trigger buying in select stocks and sectors. At the same time, holiday vacations reduce market participation, leading to thinner volumes that tend to amplify price movements.
Tax-related selling also creates short-term pressure as investors book losses, often followed by recovery buying. Add festive optimism and year-end bonuses entering the system, and the environment becomes favorable for short term positional trading advice to work effectively—provided risk is managed well.
Interestingly, despite this bias, December’s average daily returns are lower compared to November and January, and volatility tends to be higher. In simple terms, the path can be rough—but the destination often ends up higher.
The 2025 Santa Rally: A Different Backdrop, Familiar Hope
As markets move into the closing sessions of 2025, the setup feels cautiously optimistic. The Sensex recently crossed the 85,500 mark, supported by improving sentiment and selective buying.
This year’s rally attempt comes amid mixed signals. Foreign investors have withdrawn capital for much of the year, but signs suggest the outflow may be slowing. On the domestic side, institutional investors continue to provide strong support, with monthly SIP inflows exceeding ₹20,000 crore, creating a solid liquidity base.
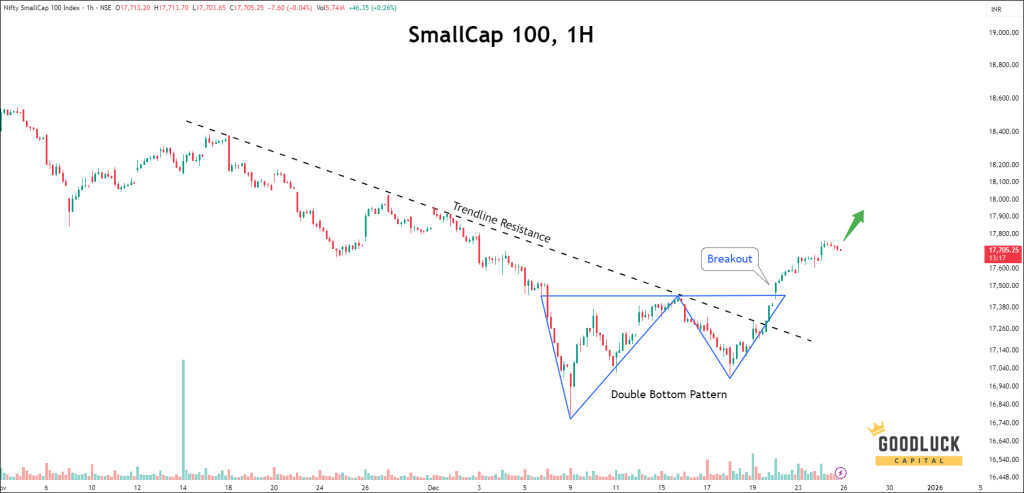
Technically, small-cap indices are showing encouraging signs. Patterns like a double bottom and improving market breadth indicate a potential shift toward strength. A growing number of small-cap stocks are trading above short-term moving averages, hinting at renewed buying interest.
Global strategists also see scope for a year-end rally, with expectations that Indian indices could push higher into January if conditions remain supportive.
Where the Rally Usually Shows Up
History suggests that not all stocks benefit equally during the Santa Rally. Small-caps consistently take center stage, followed by mid-caps. Certain sectors have also stood out over the years, particularly metals, real estate, and media, which tend to respond well to cyclical demand and improving sentiment during this period.
IT and banking stocks have shown mixed behavior, though selective strength has appeared even when broader trends remained muted.
A Necessary Reality Check
Despite its strong track record, the Santa Claus Rally is not guaranteed. There have been years when global shocks, geopolitical tensions, or unexpected economic developments completely overpowered seasonal optimism. December has seen sharp declines in the past, reminding investors that no pattern works every time.
That said, history also shows that downside during this period has usually been limited. Even when the rally fails to materialize, losses tend to be contained.
How Different Investors Can Approach This Season
For short-term traders, thinner volumes can create sharper moves, making small and mid-cap stocks attractive for tactical trades. For long-term SIP investors, however, this period is just another month in a long journey, where consistency matters far more than seasonal timing.
Active investors may find this window useful for accumulating quality stocks that have underperformed earlier in the year, especially in the small and mid-cap space. Still, position sizing, risk control, and discipline remain essential.
The Final Takeaway: Optimism with Discipline
The Santa Claus Rally is one of the few seasonal market patterns that has consistently shown up in Indian equities. The logic behind it—sentiment, liquidity, and year-end positioning—makes sense, and the data supports its existence.
Yet, Santa’s gift isn’t automatic. It favors investors who are prepared, patient, and disciplined rather than those chasing quick gains. As 2025 draws to a close, the odds may lean toward the bulls, particularly in selective segments, but the best investment strategy remains unchanged.
Stay informed, manage risk, and think long term. If Santa delivers gains this season, enjoy them—but never depend on them.
Happy Holidays, and may the markets treat you kindly.