StopLoss*: Apply on the daily close. After the first target, reset the StopLoss to your buying price.
Duration^: Approximate holding period based on the active trading days (excluding market holidays). Actual holding may vary with the market conditions.
Upside Potential#: Based on median of the suggested buy range.
Balaji Amines Limited is a leading Indian specialty chemicals company that manufactures methylamines, ethylamines, specialty chemicals, and pharma excipients. Its products are widely used in industries such as pharmaceuticals, agrochemicals, paints, textiles, water treatment, and animal feed. The company also operates a hotel business through Balaji Sarovar Premiere in Solapur. Founded in 1988, Balaji Amines serves both domestic and international markets, exporting to countries across North America, Europe, Asia, Africa, and Latin America.
Solid quarter, margins bounced back: Revenue grew 12% YoY to ₹403 crore; EBITDA margin jumped sharply to 25% from 19% a year ago. PAT surged 62% to ₹65 crore, a strong recovery.
Full year was steady, not spectacular: FY26 revenue was ₹1,454 crore with PAT of ₹169 crore, up 7% YoY. Margins improved but volume growth remained modest due to low capacity utilisation.
Zero debt, strong balance sheet: Standalone business remains completely debt-free, with net worth growing to ₹2,152 crore. Dividend of ₹11 per share recommended for FY26.
New products coming in FY27: DME, NMM, and acetonitrile plants are being commissioned in FY27, targeting emerging sectors like battery chemicals. These are new products, not just more of the same.
Watch out for risks: Capacity utilisation is still low at 35-40%. A large customer is also doing backward integration which could impact methylamines volumes. Government approvals for DME transportation are still pending, which could delay revenue from that segment.
Financial Highlights
Metric
Q4 FY26 (Mar '26)
Q3 FY26 (Dec '25)
Q4 FY25 (Mar '25)
QoQ Change
YoY Change
Revenue from Operations
395
331
353
▲ 19.3%
▲ 11.9%
EBITDA (Operating Profit)
94
57
60
▲ 64.9%
▲ 56.7%
EBITDA Margin (OPM %)
24%
17%
17%
▲ 700 bps
▲ 700 bps
Net Profit (PAT)
65
31
40
▲ 109.7%
▲ 62.5%
EPS (₹)
19.51
9.7
12.36
▲ 101.1%
▲ 57.8%
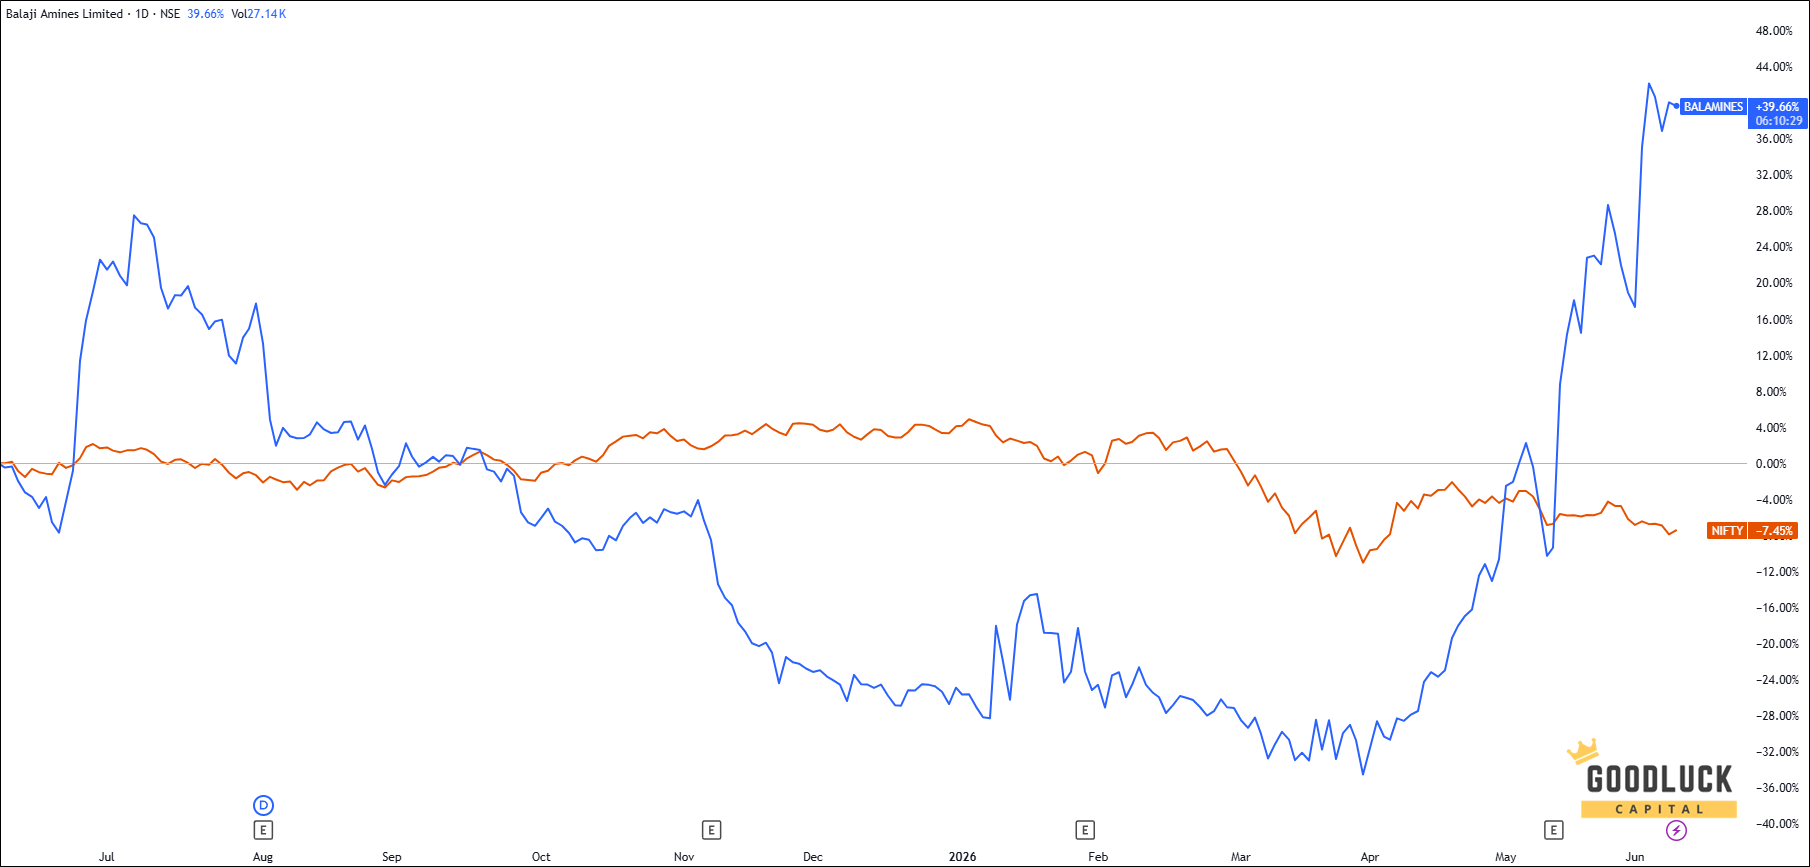
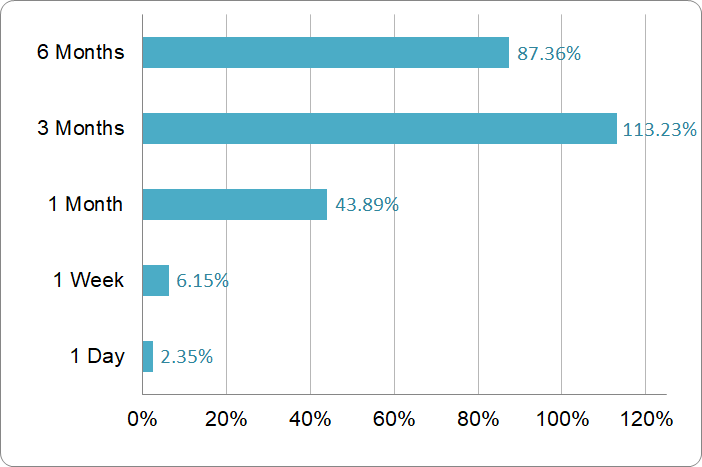
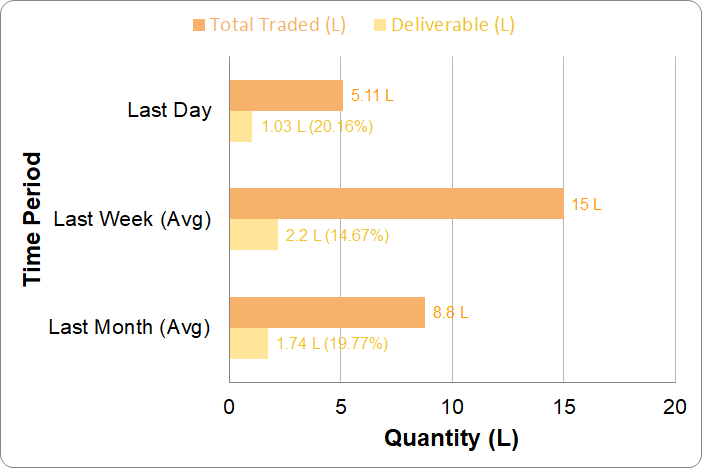
Price Performance & Volume Analysis
Price Performance
Volume Analysis
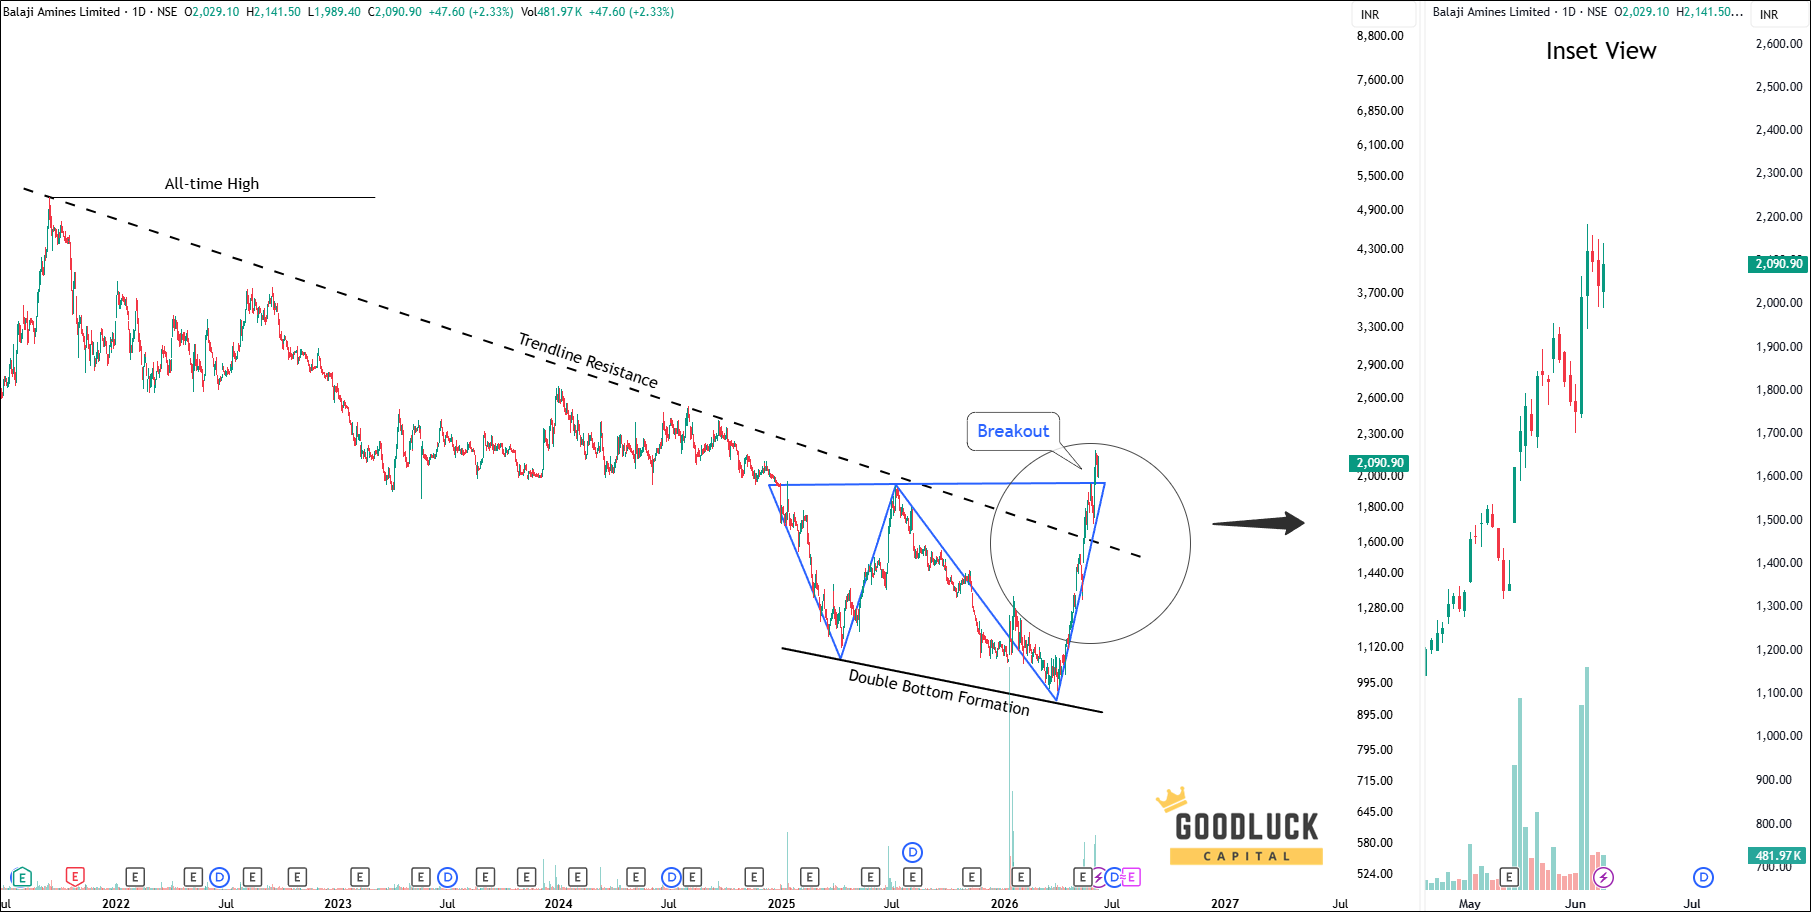
Technical Analysis
Key Observations
After a steep decline, the stock formed a solid base and developed a double bottom pattern. It first broke above the descending trendline resistance and subsequently crossed the pattern’s neckline, confirming the bullish breakout.
If buying momentum remains strong, the stock could extend its upward rally in the near term.
Based on our best stock advisor in India, the Balaji Amines stock price target will be INR 2222 - INR 2244 in the next 12-14 trading sessions.
MONEY MANAGEMENT AND TRADING RULES
Buy within the recommended price range. You may allow up to 1% flexibility beyond the range if needed.
No need to rush. The recommendation remains valid for up to 7 days, not just at market open.
Use a trailing stop-loss to protect and lock in profits.
Diversify your trading capital across our other recommended stocks to reduce risk.
Invest responsibly. Trade only with funds you can afford to lose and hedge positions where appropriate.
Analyst Summary
The research analysis is prepared by Arijit Banerjee, CMT, CFTe. He is a veteran trader and an active investor having in-depth knowledge in financial market research, advanced technical analysis, market cycle, algorithmic trading and portfolio management. Arijit is a Chartered Market Technician (CMT) accredited by CMT Association USA, the leading global authority of Technical Analysis and has been honoured by Certified Financial Technician (CFTe) from the International Federation of Technical Analysts, USA. SEBI, the regulatory body of Indian financial market also recognizes him as a Research Analyst (INH300006582).
The views expressed herein are based solely on information available publicly/internal data/other sources believed to be reliable, but is not necessarily all-inclusive and is not guaranteed as to accuracy. The recommendations provided herein is solely for informational purposes and are not intended to be and must not be taken alone as the basis for an investment/trading decision. Trading and investing are subject to market risk and the securities discussed and opinions expressed herein may not be suitable for all investors. To read the full disclosure, please click here.
Your Return Could be Much Better
Increase your Profitable!
Swing Trading Advice
10—12 swing trade advice / month
expected upside 6%—8% per trade
short term trade holding 1-2 weeks
minimum capital required ₹ 3-lakh
receive trade advice before 9:00 am
trade ideas by blackbox system, relied on statistics, technical, fundamental, macroeconomics and sentiment