StopLoss*: Apply on the daily close. After the first target, reset the StopLoss to your buying price.
Duration^: Approximate holding period based on the active trading days (excluding market holidays). Actual holding may vary with the market conditions.
Upside Potential#: Based on median of the suggested buy range.
NATCO Pharma Limited is an Indian pharmaceutical company that develops, manufactures, and sells medicines, APIs, and specialty healthcare products. It has a strong presence in oncology (cancer treatment) and also operates in cardiology, neurology, gastroenterology, and diabetes care. The company serves markets in India, the U.S., and other countries, and also has an agrochemicals business. Founded in 1981, NATCO Pharma is headquartered in Hyderabad, India.
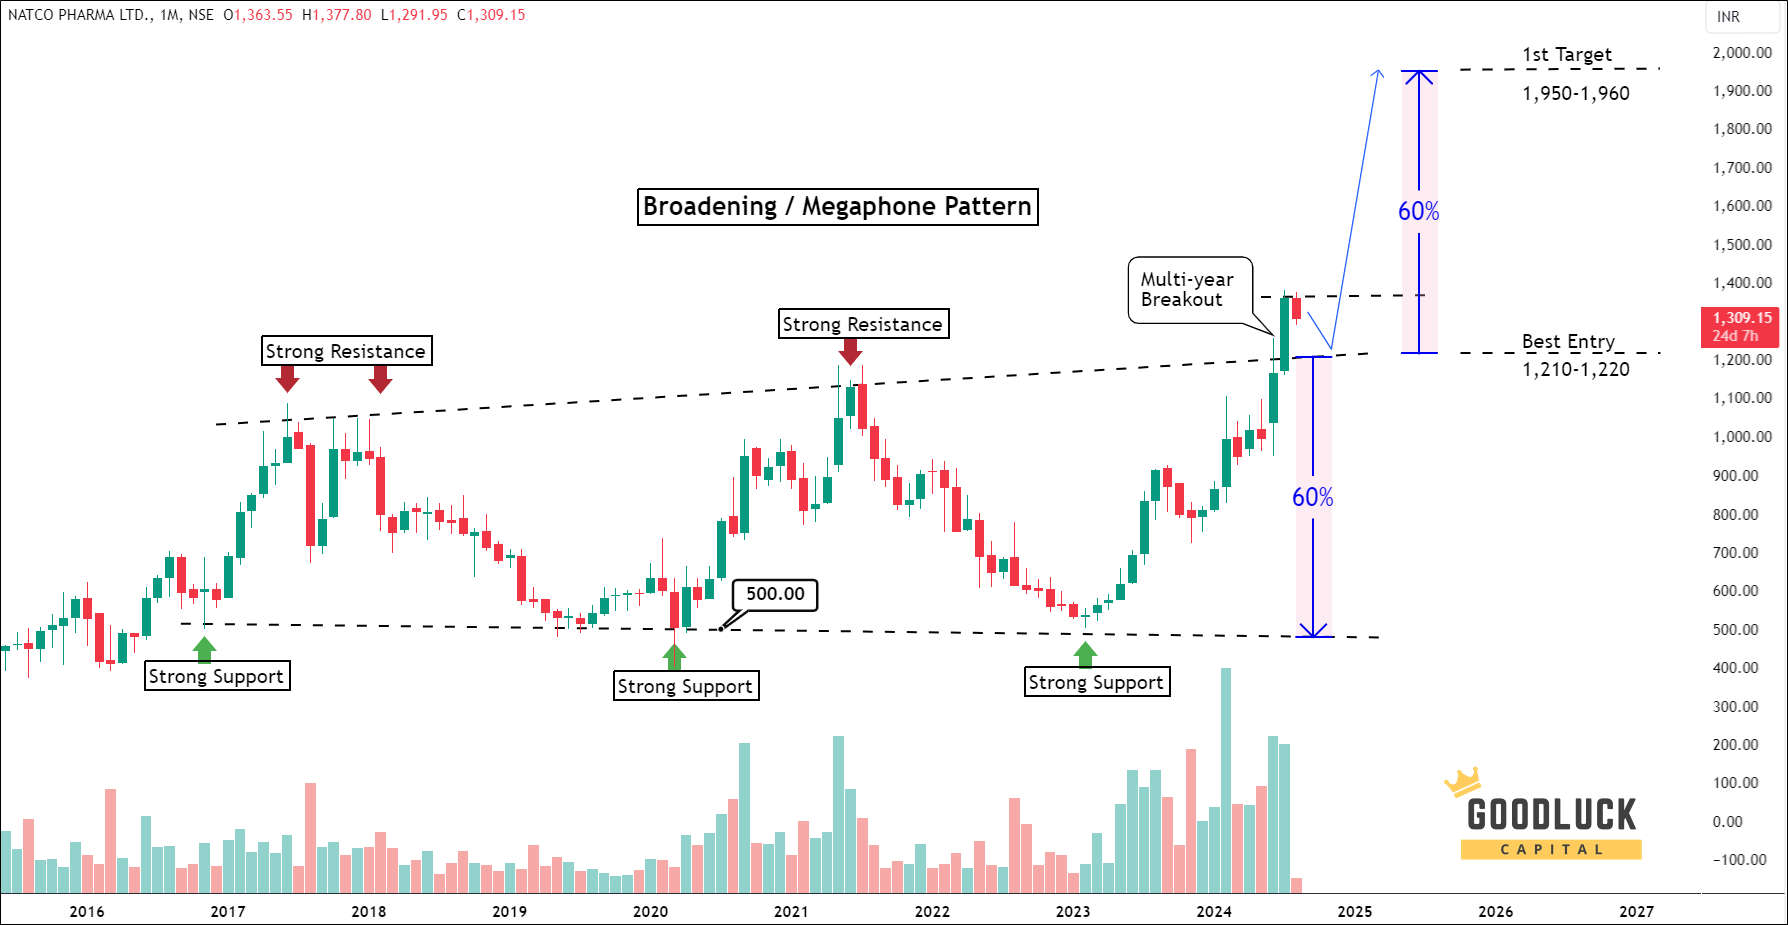
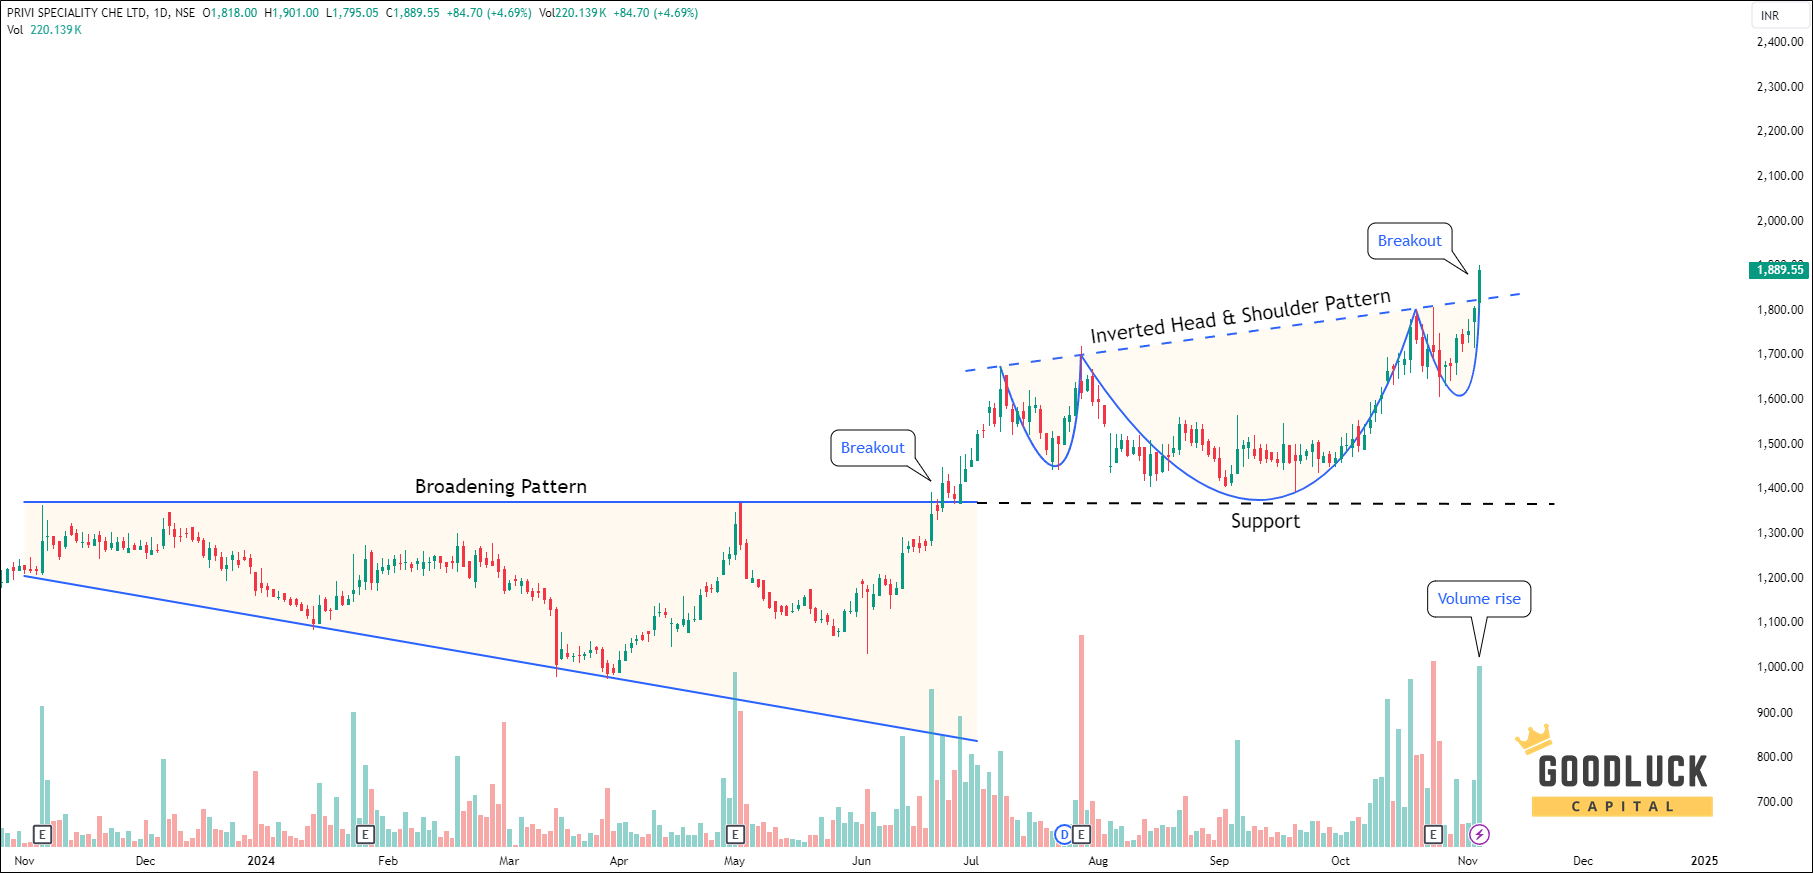
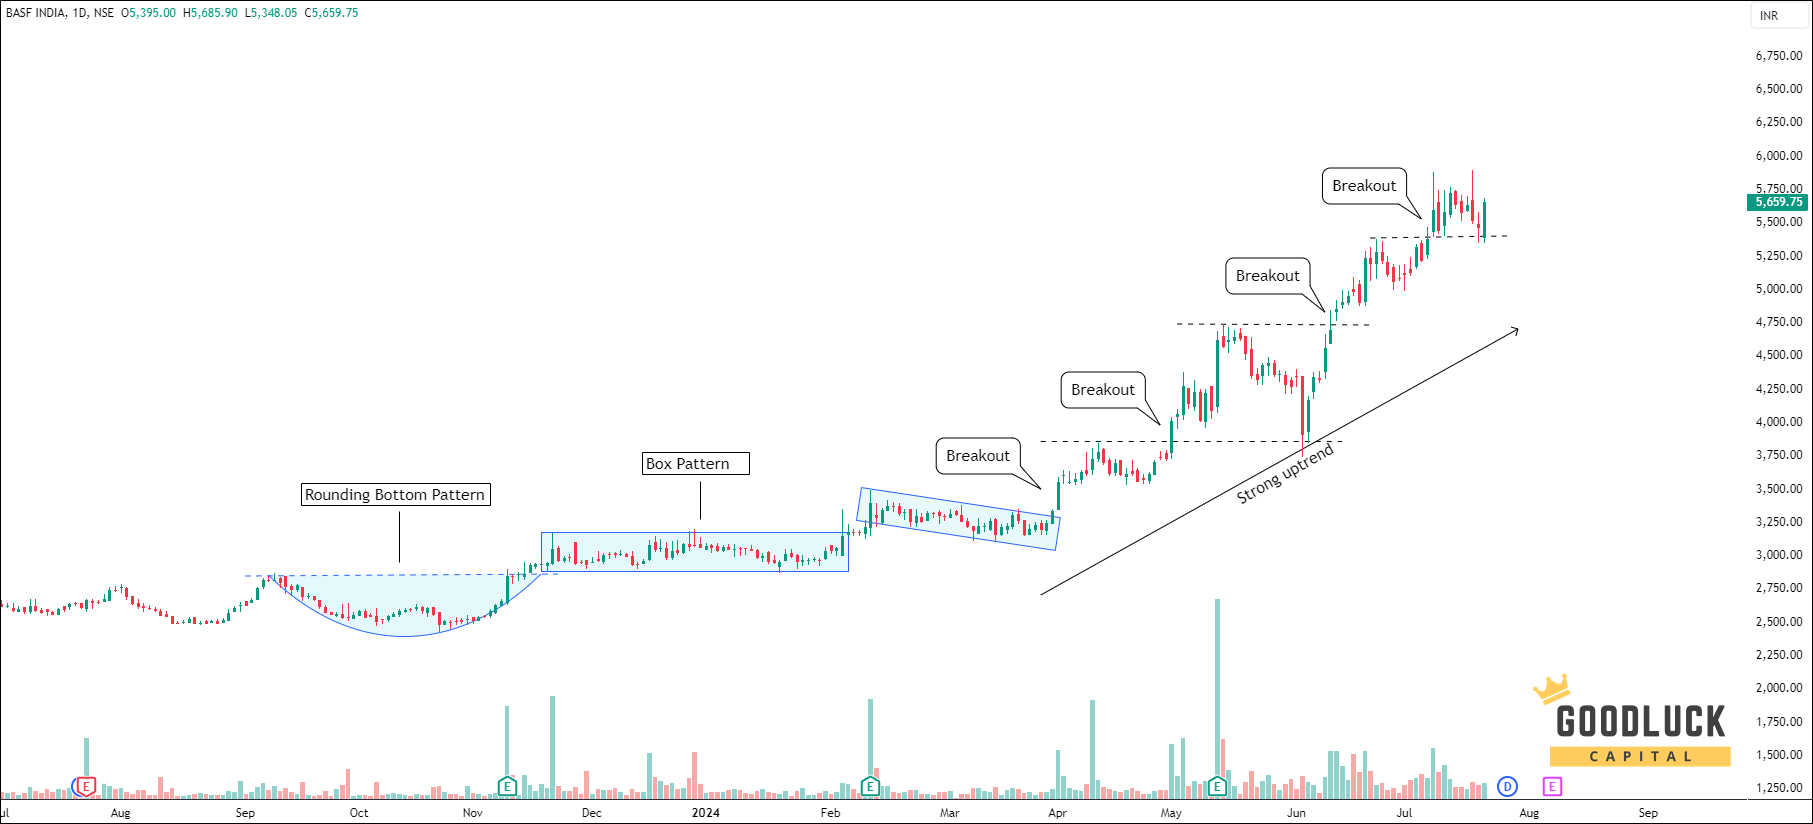
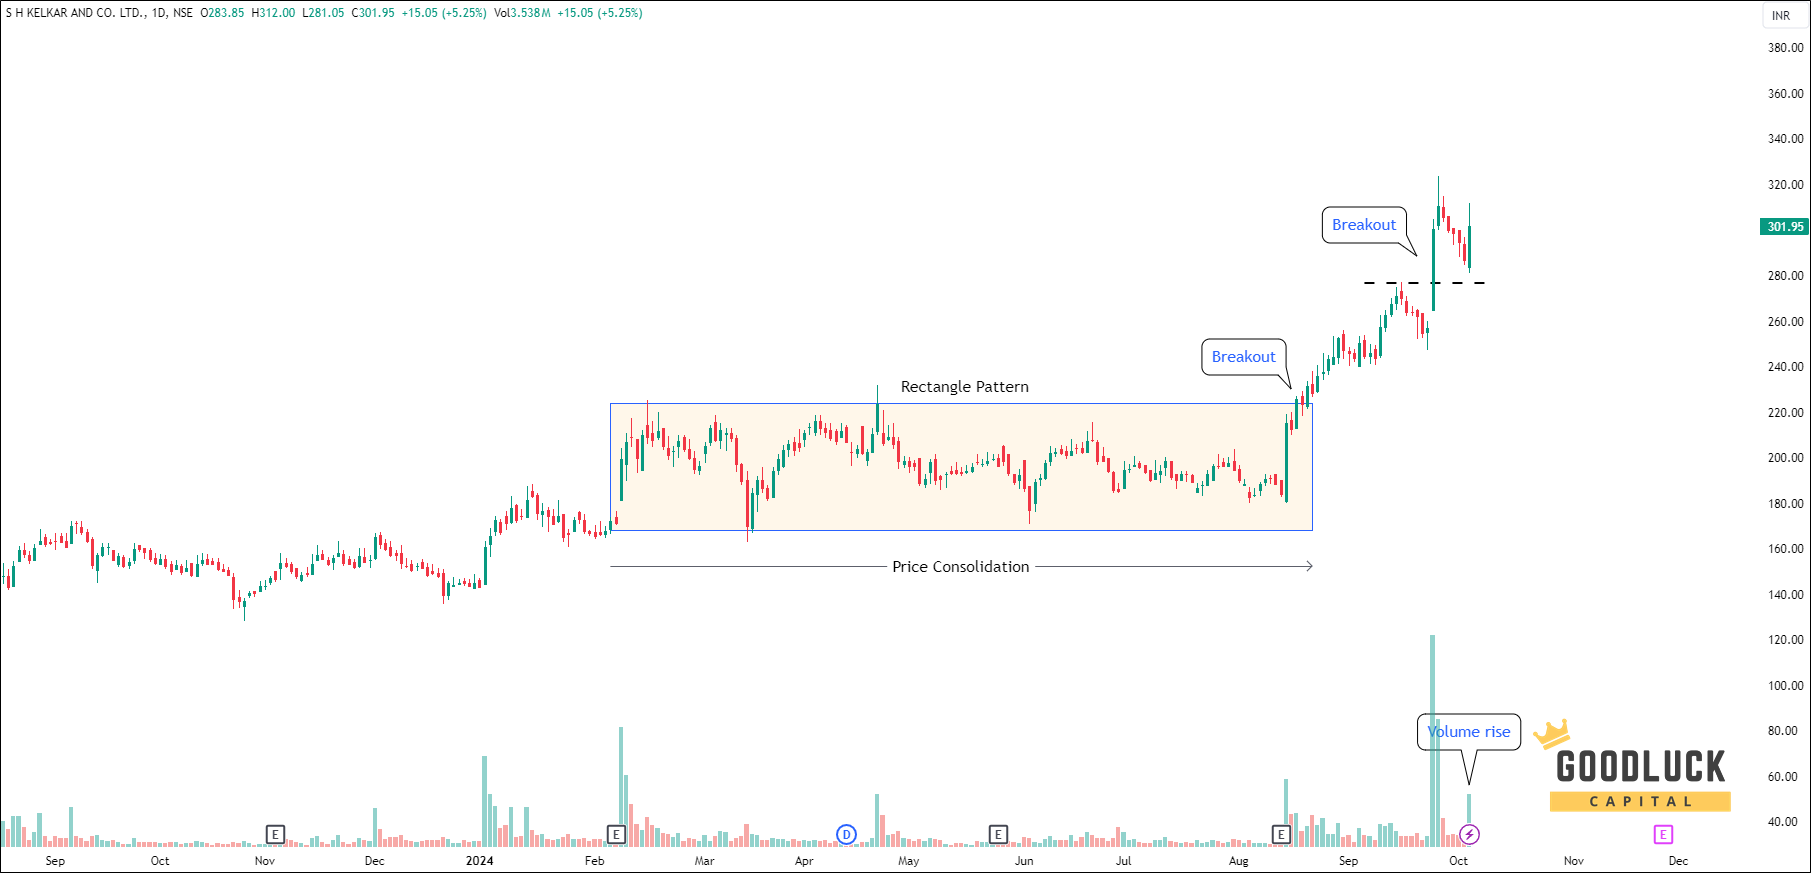
Back in 2017, Natco Pharma encountered several rejections around the 1,050 level, leading to a subsequent decline.
The 500 level has emerged as a crucial support point, allowing the stock to bounce back from this threshold.
Although the stock made an attempt to surpass its trendline resistance in July 2021, it ultimately fell short, resulting in another correction before finding support at the 500 level once more.
Since March 2023, the stock has been on an upward trajectory, successfully breaking through the resistance level in July 2024.
Following this significant multi-year breakout, there is a strong expectation that the stock will remain above the breakout zone, paving the way for a robust upward rally.
Technical Image
Technical Analysis
Key Observations
Back in 2017, Natco Pharma encountered several rejections around the 1,050 level, leading to a subsequent decline.
The 500 level has emerged as a crucial support point, allowing the stock to bounce back from this threshold.
Although the stock made an attempt to surpass its trendline resistance in July 2021, it ultimately fell short, resulting in another correction before finding support at the 500 level once more.
Since March 2023, the stock has been on an upward trajectory, successfully breaking through the resistance level in July 2024.
Following this significant multi-year breakout, there is a strong expectation that the stock will remain above the breakout zone, paving the way for a robust upward rally.
Technical Image
Fundamental Analysis
PE Ratio
The stock's current PE stands at 16.9, slightly higher than the 1-year median PE of 14.2 but lower than the 5-year median PE of 26.3.
With an industry PE of 36.6, the stock appears undervalued.
PB Ratio
The present PB ratio for this stock stands at 3.96, indicating a slightly high valuation but not reaching overvalued territory.
Debt to Equity Ratio
The company's debt to equity ratio of 0.06 indicates that it is nearly debt-free.
Profit & Loss Analysis
Over the last three years, this stock has experienced a remarkable compounded annual sales growth rate of 25%.
The cumulative profit increase over the past three years has been an impressive 49%, indicating a strong upward trend.
The profit margin has seen a significant boost, rising to 44% from 35% YoY.
The EPS growth for FY24 is remarkable, soaring to 77.5 compared to just 39 in FY23.
Cashflow Analysis
There is a substantial increase in operating cash flow, jumping by almost 43% to 1,212 crore from 849 crore in FY23.
Cashflow Analysis
There is a substantial increase in operating cash flow, jumping by almost 43% to 1,212 crore from 849 crore in FY23.
Shareholding Summary
The promoters have consistently held their stakes at 49.71% over the past three quarters.
Over the last four quarters, FIIs have been steadily increasing their investments, in contrast to DIIs who have been offloading their stakes.
Shareholding Summary
The promoters have consistently held their stakes at 49.71% over the past three quarters.
Over the last four quarters, FIIs have been steadily increasing their investments, in contrast to DIIs who have been offloading their stakes.
MONEY MANAGEMENT AND TRADING RULES
Buy within the recommended price range. You may allow up to 1% flexibility beyond the range if needed.
No need to rush. The recommendation remains valid for up to 7 days, not just at market open.
Use a trailing stop-loss to protect and lock in profits.
Diversify your trading capital across our other recommended stocks to reduce risk.
Invest responsibly. Trade only with funds you can afford to lose and hedge positions where appropriate.
Analyst Summary
The research analysis is prepared by Arijit Banerjee, CMT, CFTe. He is a veteran trader and an active investor having in-depth knowledge in financial market research, advanced technical analysis, market cycle, algorithmic trading and portfolio management. Arijit is a Chartered Market Technician (CMT) accredited by CMT Association USA, the leading global authority of Technical Analysis and has been honoured by Certified Financial Technician (CFTe) from the International Federation of Technical Analysts, USA. SEBI, the regulatory body of Indian financial market also recognizes him as a Research Analyst (INH300006582)
The views expressed herein are based solely on information available publicly/internal data/other sources believed to be reliable, but is not necessarily all-inclusive and is not guaranteed as to accuracy. The recommendations provided herein is solely for informational purposes and are not intended to be and must not be taken alone as the basis for an investment/trading decision. Trading and investing are subject to market risk and the securities discussed and opinions expressed herein may not be suitable for all investors. To read the full disclosure, please click here.
Your Return Could be Much Better
Increase your Profitable!
Swing Trading Advice
10—12 swing trade advice / month
expected upside 6%—8% per trade
short term trade holding 1-2 weeks
minimum capital required ₹ 3-lakh
receive trade advice before 9:00 am
trade ideas by blackbox system, relied on statistics, technical, fundamental, macroeconomics and sentiment