StopLoss*: Apply on the daily close. After the first target, reset the StopLoss to your buying price.
Duration^: Approximate holding period based on the active trading days (excluding market holidays). Actual holding may vary with the market conditions.
Upside Potential#: Based on median of the suggested buy range.
Rashi Peripherals Limited is one of India’s leading technology distributors. It supplies a wide range of IT and electronic products from global brands, including laptops, desktops, servers, cloud solutions, networking equipment, consumer electronics, and IT accessories. The company also provides technical support, marketing, warranty management, and financing solutions to its business partners. Founded in 1989, Rashi Peripherals is headquartered in Mumbai, India.
Record year: FY26 revenue grew 51% YoY to ₹4,489 crore. EBITDA increased 41%, while net profit (PAT) jumped 65% to ₹87 crore, making it the company's best-ever year.
Better profitability: Revenue grew strongly, while costs remained under control, helping profits grow much faster than sales.
Strong financial position: CRISIL reaffirmed the company's AA-/Stable and A1+ credit ratings, reflecting confidence in its balance sheet and financial strength.
Expanding into technology services: Rashi acquired a 67% stake in VDA Infosolutions for ₹368.5 crore. The acquisition adds a fast-growing technology services business with higher profit margins.
Q1 FY27 results in focus: Management's commentary after the August 5 earnings call will be closely watched for updates on revenue growth, margins, and VDA integration.
Financial Highlights
Metric
Q1 FY27 (Jun '26)
Q4 FY26 (Mar '26)
Q1 FY26 (Jun '25)
QoQ Change
YoY Change
Revenue from Operations
5,102
4,489
3,152
▲ 13.7%
▲ 61.9%
EBITDA (Operating Profit)
155
133
104
▲ 16.5%
▲ 49.0%
EBITDA Margin (OPM %)
3.00%
3.00%
3.30%
—
▼ 30 bps
Net Profit (PAT)
105
87
62
▲ 20.7%
▲ 69.4%
EPS (₹)
15.59
12.78
9.31
▲ 21.8%
▲ 67.5%
Price Performance & Volume Analysis
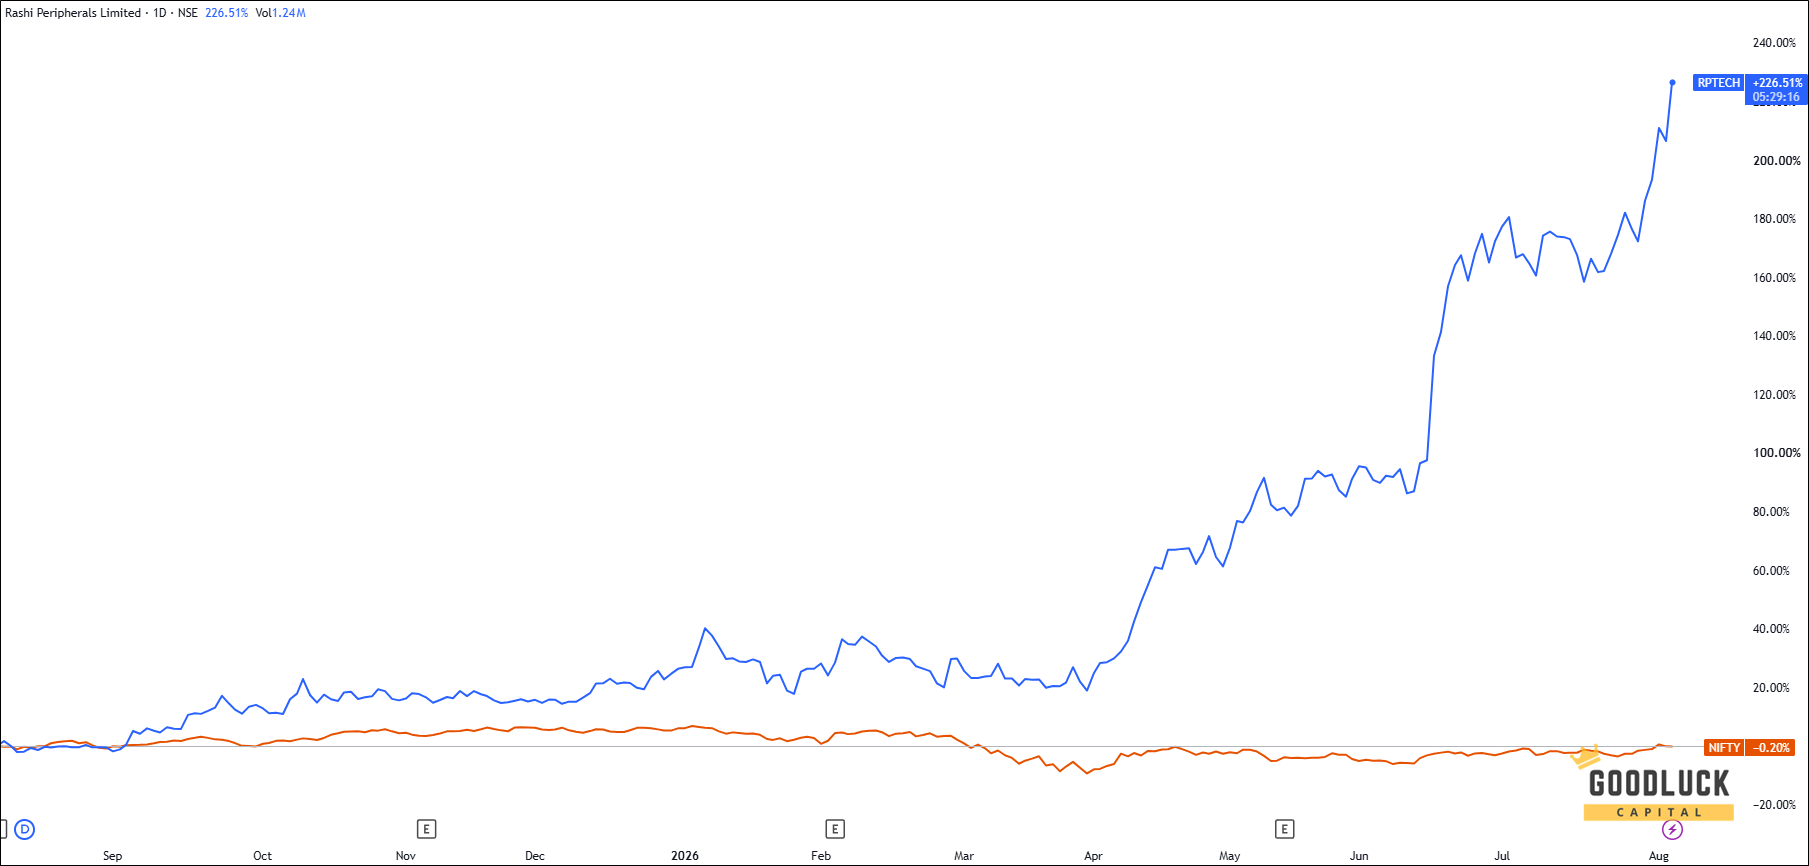
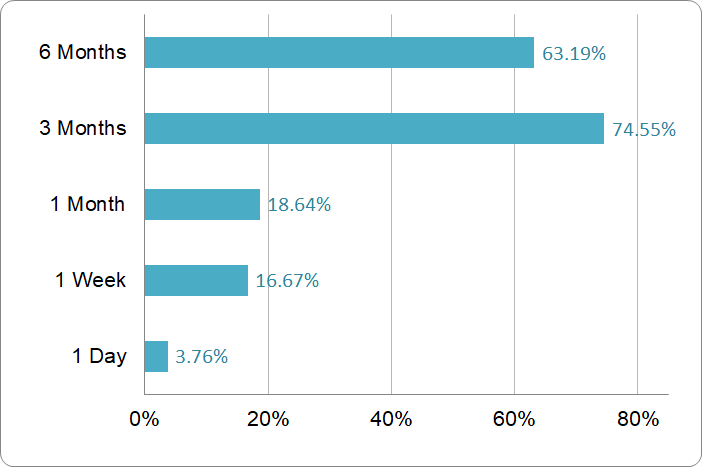
Price Performance
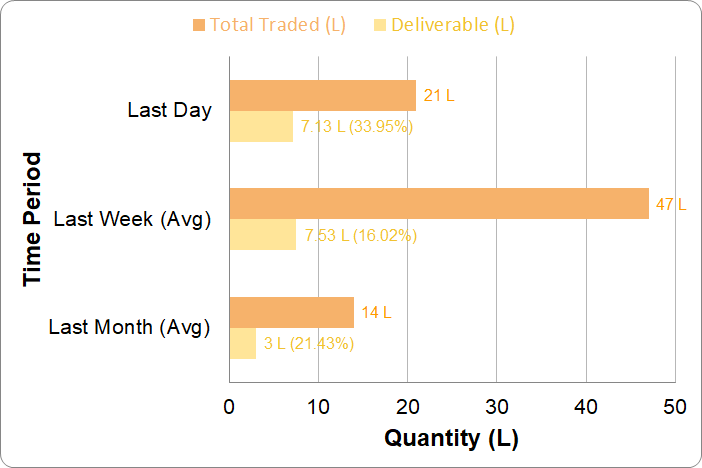
Volume Analysis
Technical Analysis
Key Observations
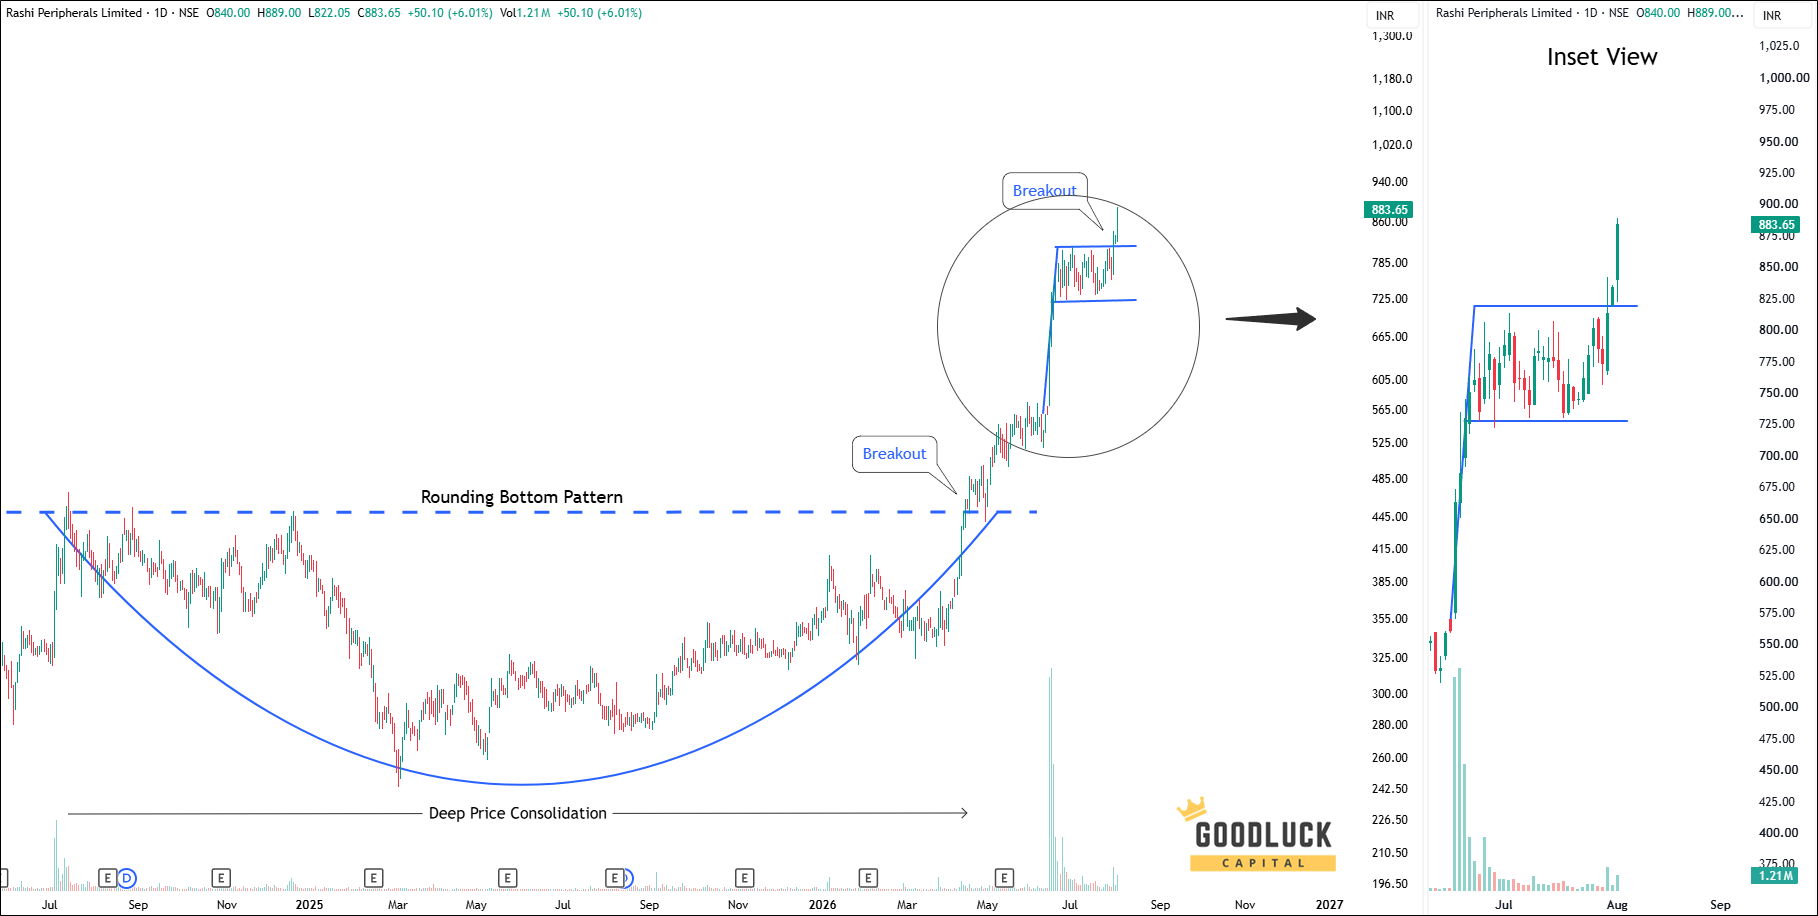
Following a breakout from a rounding bottom pattern, the stock surged higher and formed a bullish pole-and-flag pattern.
After breaking out of the flag, it climbed to a new all-time high, signaling strong bullish momentum that is likely to continue as long as the breakout level holds.
Based on our Swing share trading tips in India, the Rashi Peripherals stock price target will be INR 370 - INR 375 in the next 12-14 trading sessions.
MONEY MANAGEMENT AND TRADING RULES
Buy within the recommended price range. You may allow up to 1% flexibility beyond the range if needed.
No need to rush. The recommendation remains valid for up to 7 days, not just at market open.
Use a trailing stop-loss to protect and lock in profits.
Diversify your trading capital across our other recommended stocks to reduce risk.
Invest responsibly. Trade only with funds you can afford to lose and hedge positions where appropriate.
Analyst Summary
The research analysis is prepared by Arijit Banerjee, CMT, CFTe. He is a veteran trader and an active investor having in-depth knowledge in financial market research, advanced technical analysis, market cycle, algorithmic trading and portfolio management. Arijit is a Chartered Market Technician (CMT) accredited by CMT Association USA, the leading global authority of Technical Analysis and has been honoured by Certified Financial Technician (CFTe) from the International Federation of Technical Analysts, USA. SEBI, the regulatory body of Indian financial market also recognizes him as a Research Analyst (INH300006582).
The views expressed herein are based solely on information available publicly/internal data/other sources believed to be reliable, but is not necessarily all-inclusive and is not guaranteed as to accuracy. The recommendations provided herein is solely for informational purposes and are not intended to be and must not be taken alone as the basis for an investment/trading decision. Trading and investing are subject to market risk and the securities discussed and opinions expressed herein may not be suitable for all investors. To read the full disclosure, please click here.
Your Return Could be Much Better
Increase your Profitable!
Swing Trading Advice
10—12 swing trade advice / month
expected upside 6%—8% per trade
short term trade holding 1-2 weeks
minimum capital required ₹ 3-lakh
receive trade advice before 9:00 am
trade ideas by blackbox system, relied on statistics, technical, fundamental, macroeconomics and sentiment