StopLoss*: Apply on the daily close. After the first target, reset the StopLoss to your buying price.
Duration^: Approximate holding period based on the active trading days (excluding market holidays). Actual holding may vary with the market conditions.
Upside Potential#: Based on median of the suggested buy range.
Gufic Biosciences Ltd., founded in 1970 and headquartered in Mumbai, India, is a pharmaceutical company engaged in the manufacturing of active pharmaceutical ingredients (APIs), injectable medicines, and generic pharmaceuticals. The company is a leading player in lyophilized (freeze-dried) injections, catering to therapeutic areas such as antibiotics, antifungals, cardiac care, fertility, antivirals, and critical care. It also operates in contract manufacturing and exports its products to markets across Asia, Africa, Europe, Australia, North America, and South America.
Record Q4: Revenue grew 15% YoY to ₹252 crore, while PAT more than doubled to ₹20.5 crore. EBITDA margin improved to 17.7%.
Indore plant scaling up: Capacity utilization reached 30% and achieved EBITDA breakeven. At full capacity, it can generate ₹675–700 crore in annual revenue.
New growth areas: Entered the GLP-1 (weight-loss drugs) segment and signed a licensing deal for aesthetic fillers in India.
Business momentum: Strong growth in women’s health and international markets with new approvals and global partnerships.
Positive FY27 outlook: Management expects 15% revenue growth, 18% EBITDA margin, and minimal capex with only ₹20 crore in maintenance spending.
Financial Highlights
Metric
Q4 FY26 (Mar '26)
Q3 FY26 (Dec '25)
Q4 FY25 (Mar '25)
QoQ Change
YoY Change
Revenue from Operations
252
231
205
▲ 9.1%
▲ 22.9%
EBITDA (Operating Profit)
46
36
27
▲ 27.8%
▲ 70.4%
EBITDA Margin (OPM %)
18%
16%
13%
▲ 200 bps
▲ 500 bps
Net Profit (PAT)
21
16
8
▲ 31.3%
▲ 162.5%
EPS (₹)
2.05
1.55
0.79
▲ 32.3%
▲ 159.5%
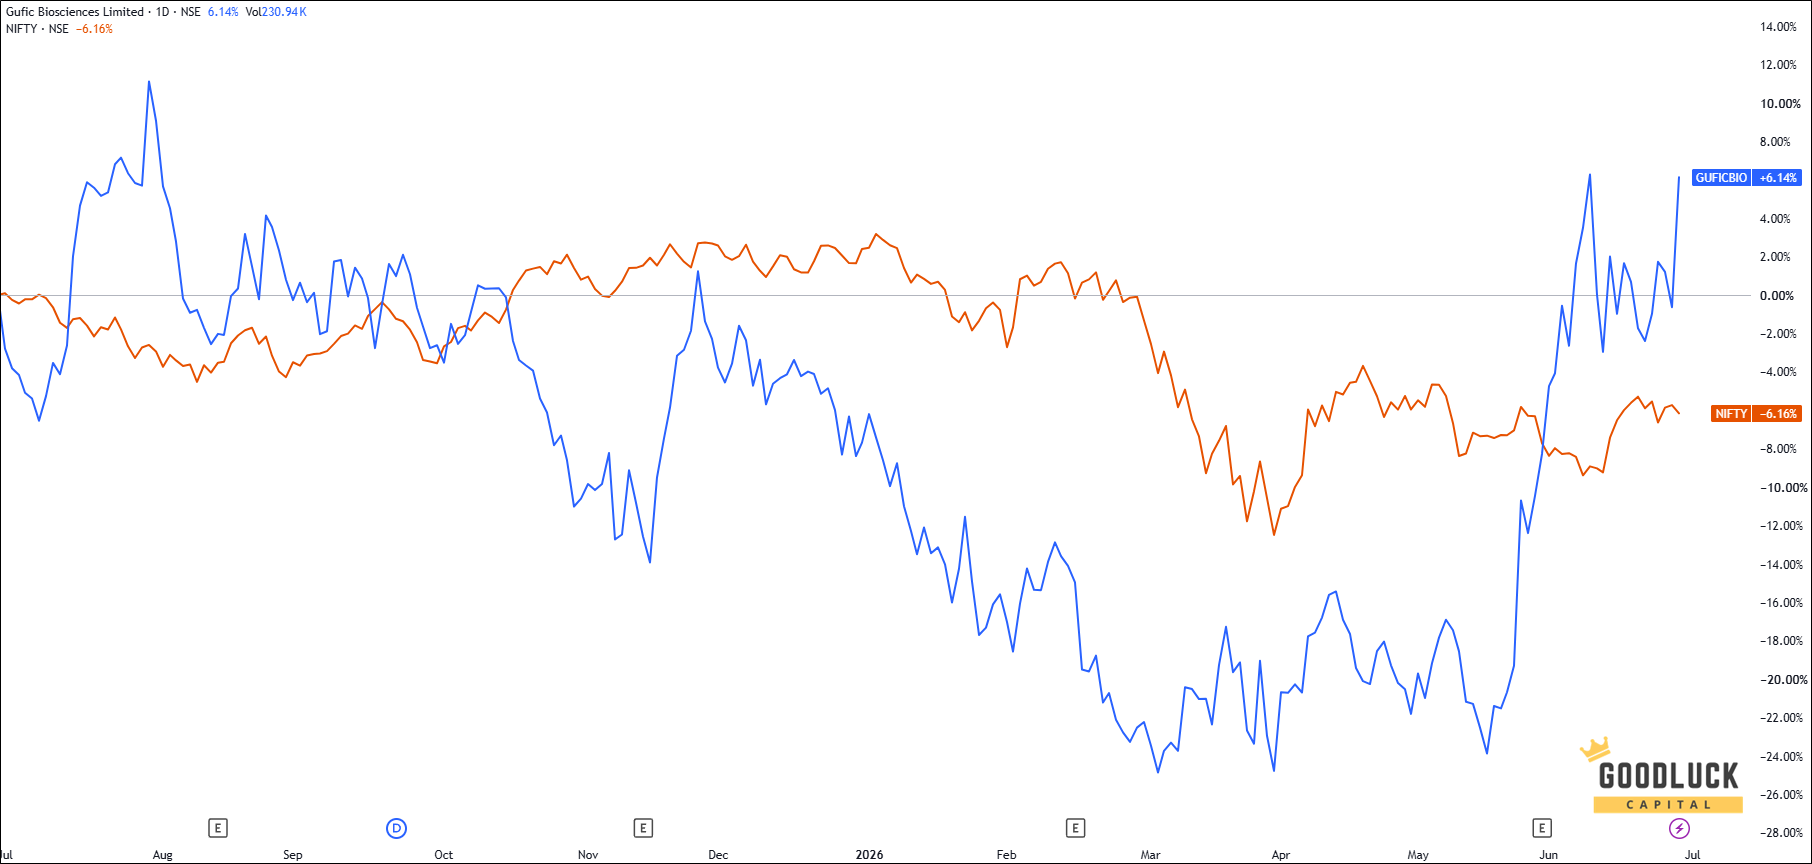
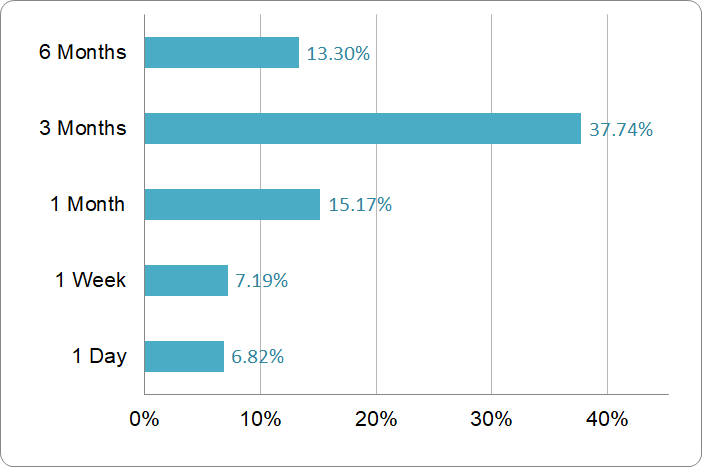
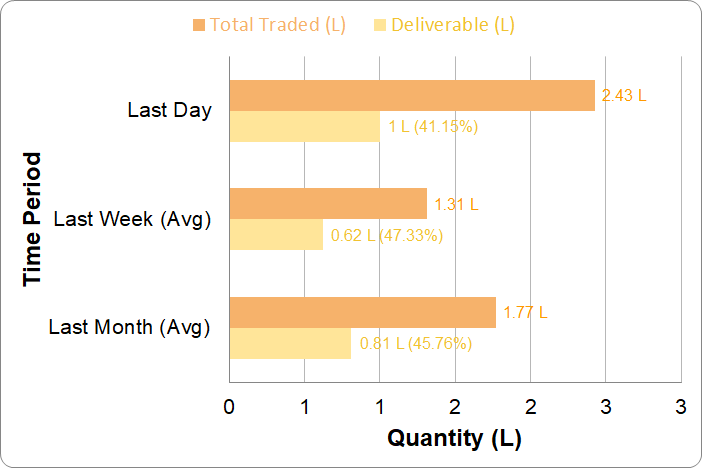
Price Performance & Volume Analysis
Price Performance
Volume Analysis
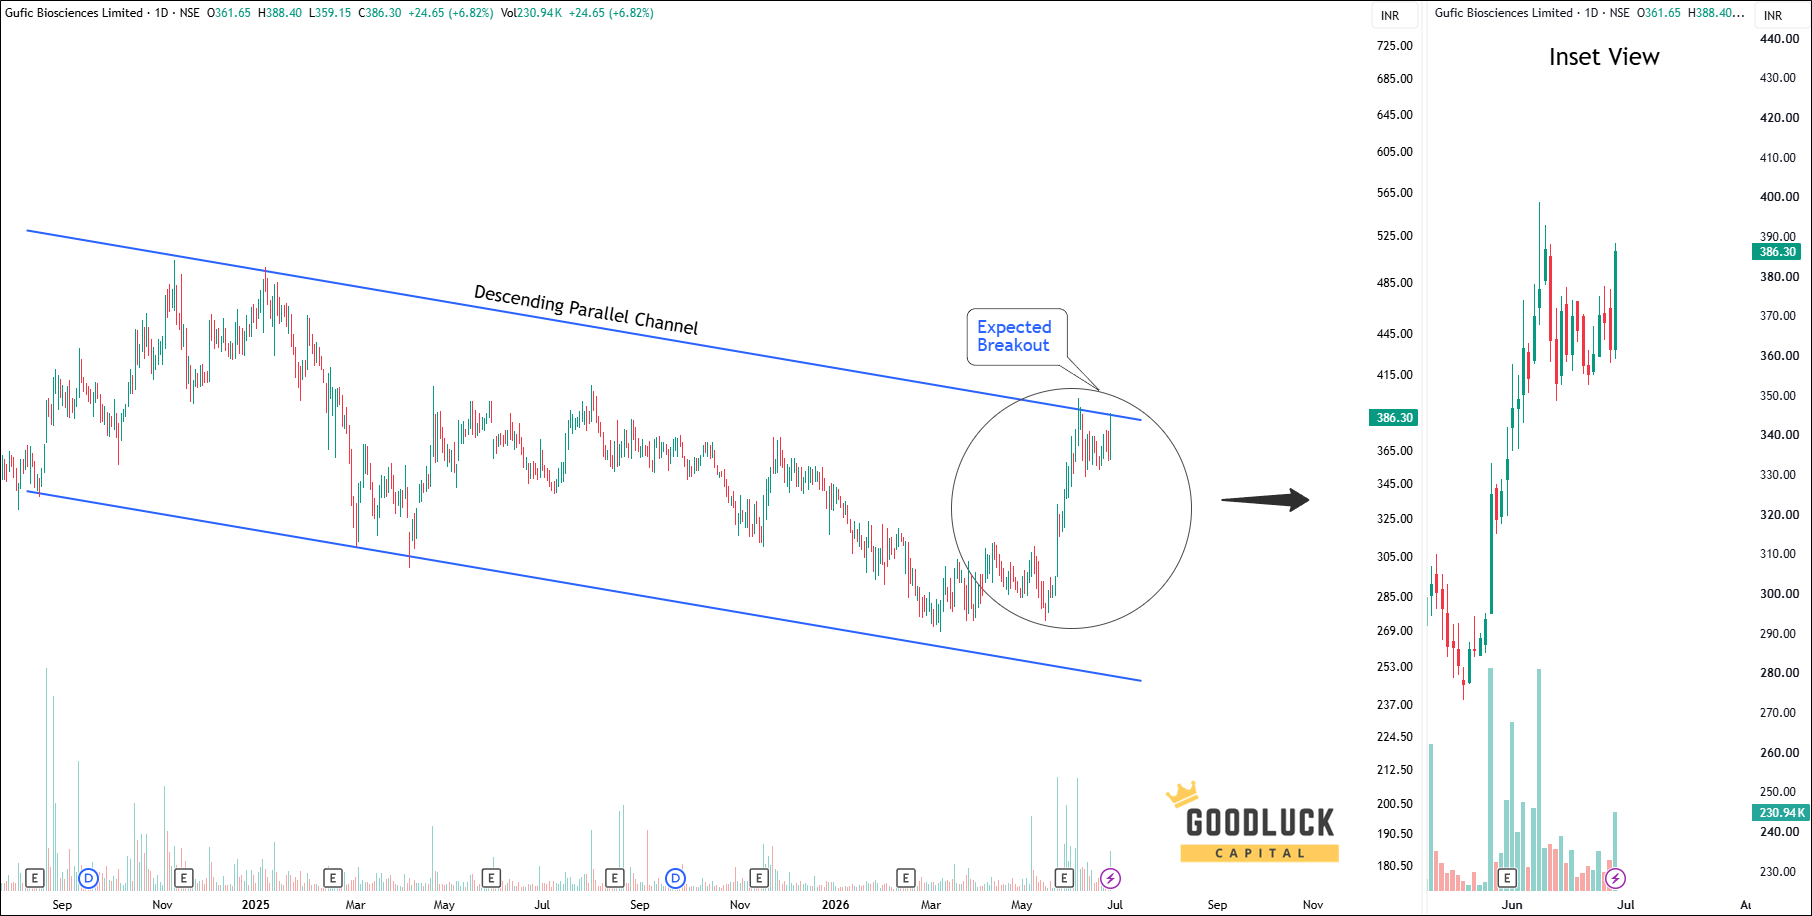
Technical Analysis
Key Observations
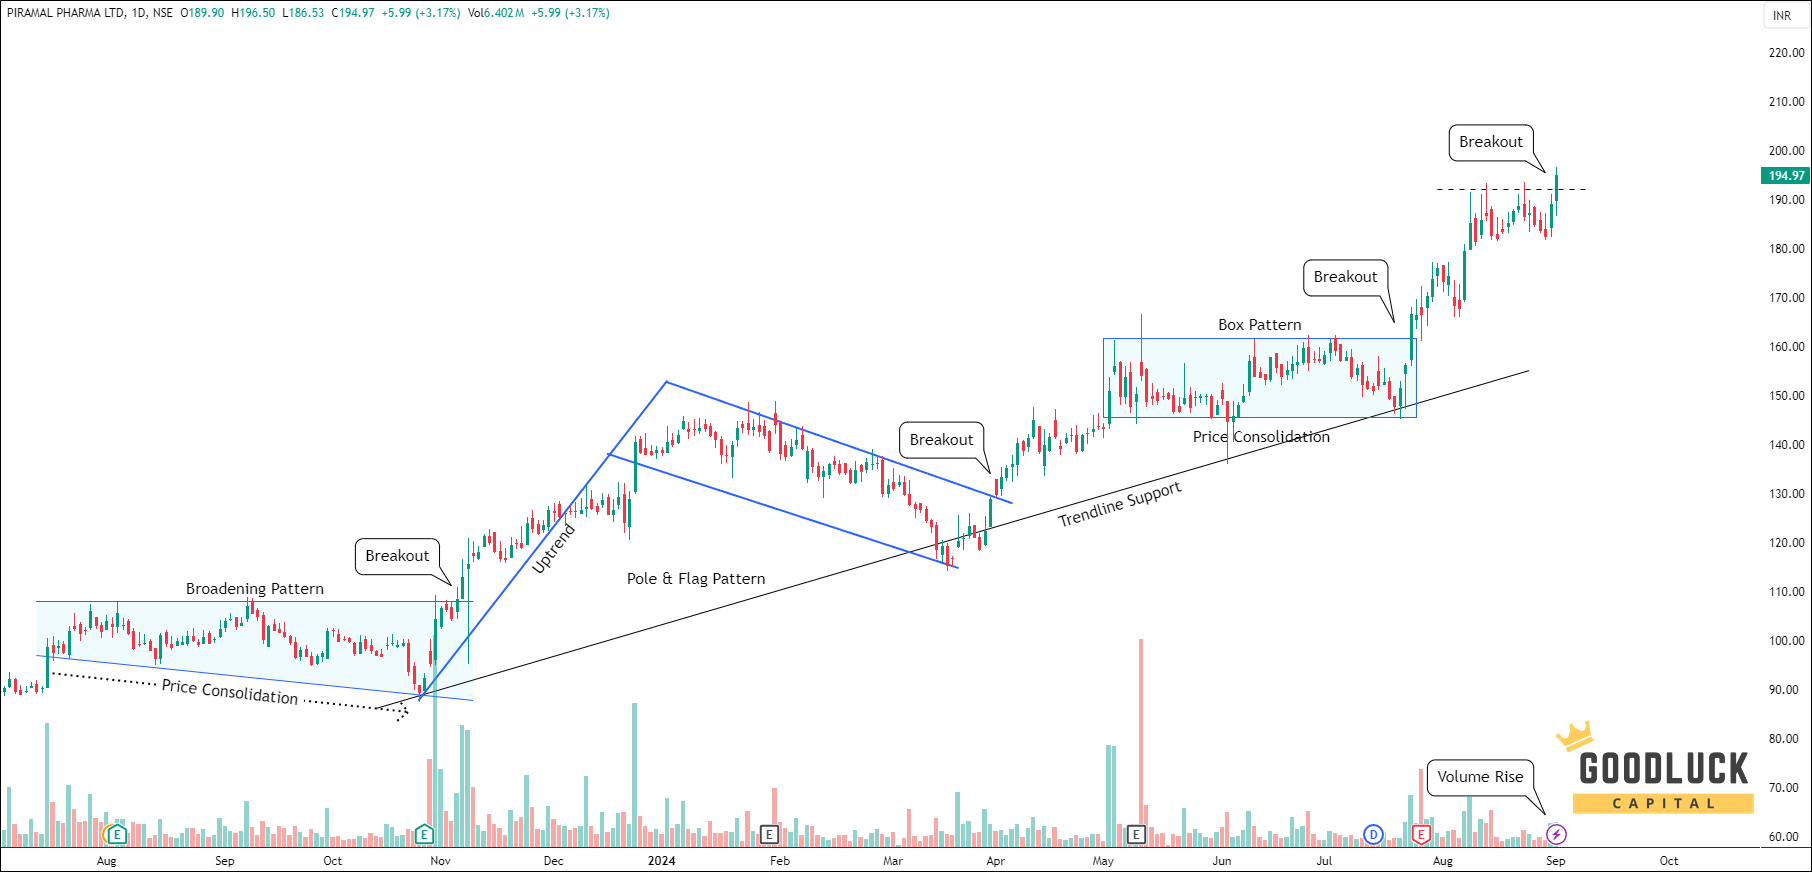
The stock is trading within a descending parallel channel and is currently testing the upper trendline resistance.
A decisive breakout above this level could signal a bullish trend reversal and may lead to further upside in the near term.
Buy within the recommended price range. You may allow up to 1% flexibility beyond the range if needed.
No need to rush. The recommendation remains valid for up to 7 days, not just at market open.
Use a trailing stop-loss to protect and lock in profits.
Diversify your trading capital across our other recommended stocks to reduce risk.
Invest responsibly. Trade only with funds you can afford to lose and hedge positions where appropriate.
Analyst Summary
The research analysis is prepared by Arijit Banerjee, CMT, CFTe. He is a veteran trader and an active investor having in-depth knowledge in financial market research, advanced technical analysis, market cycle, algorithmic trading and portfolio management. Arijit is a Chartered Market Technician (CMT) accredited by CMT Association USA, the leading global authority of Technical Analysis and has been honoured by Certified Financial Technician (CFTe) from the International Federation of Technical Analysts, USA. SEBI, the regulatory body of Indian financial market also recognizes him as a Research Analyst (INH300006582).
The views expressed herein are based solely on information available publicly/internal data/other sources believed to be reliable, but is not necessarily all-inclusive and is not guaranteed as to accuracy. The recommendations provided herein is solely for informational purposes and are not intended to be and must not be taken alone as the basis for an investment/trading decision. Trading and investing are subject to market risk and the securities discussed and opinions expressed herein may not be suitable for all investors. To read the full disclosure, please click here.
Your Return Could be Much Better
Increase your Profitable!
Swing Trading Advice
10—12 swing trade advice / month
expected upside 6%—8% per trade
short term trade holding 1-2 weeks
minimum capital required ₹ 3-lakh
receive trade advice before 9:00 am
trade ideas by blackbox system, relied on statistics, technical, fundamental, macroeconomics and sentiment