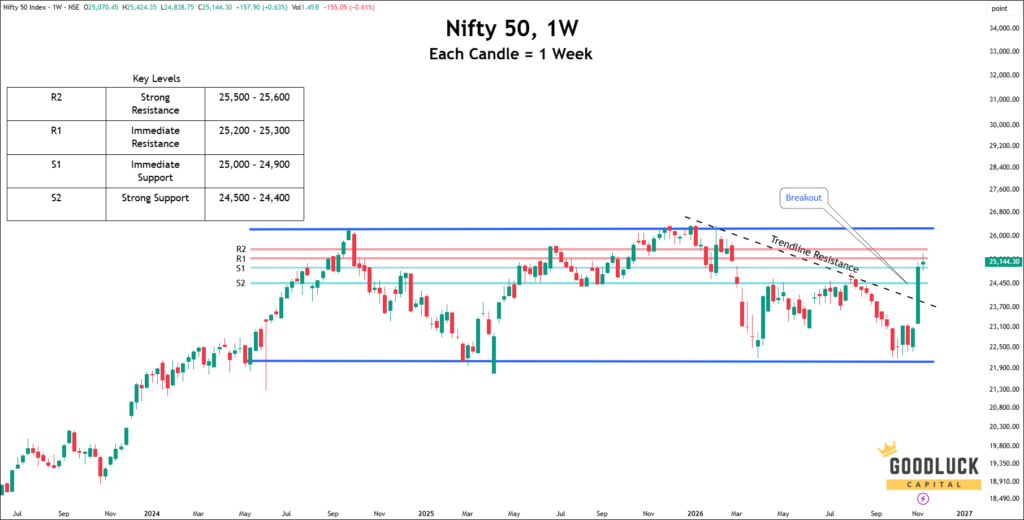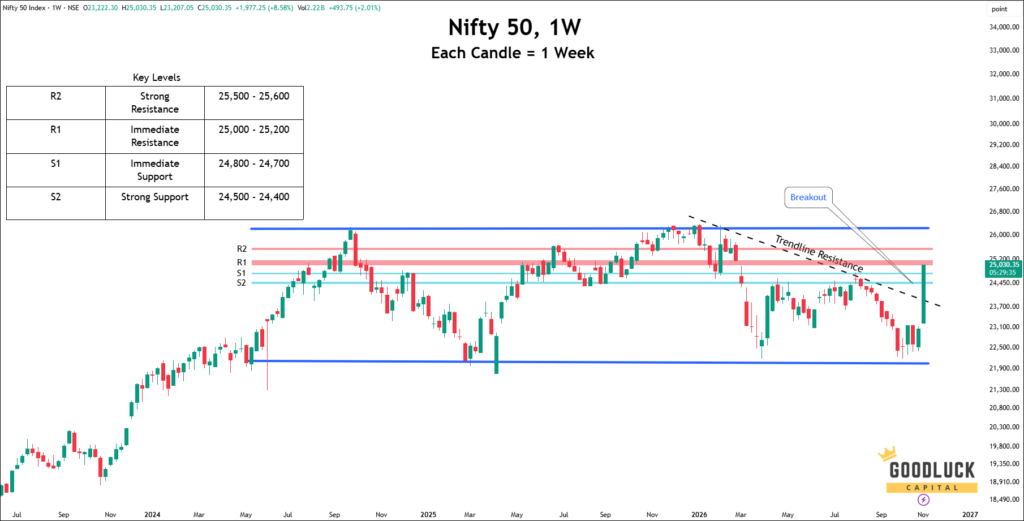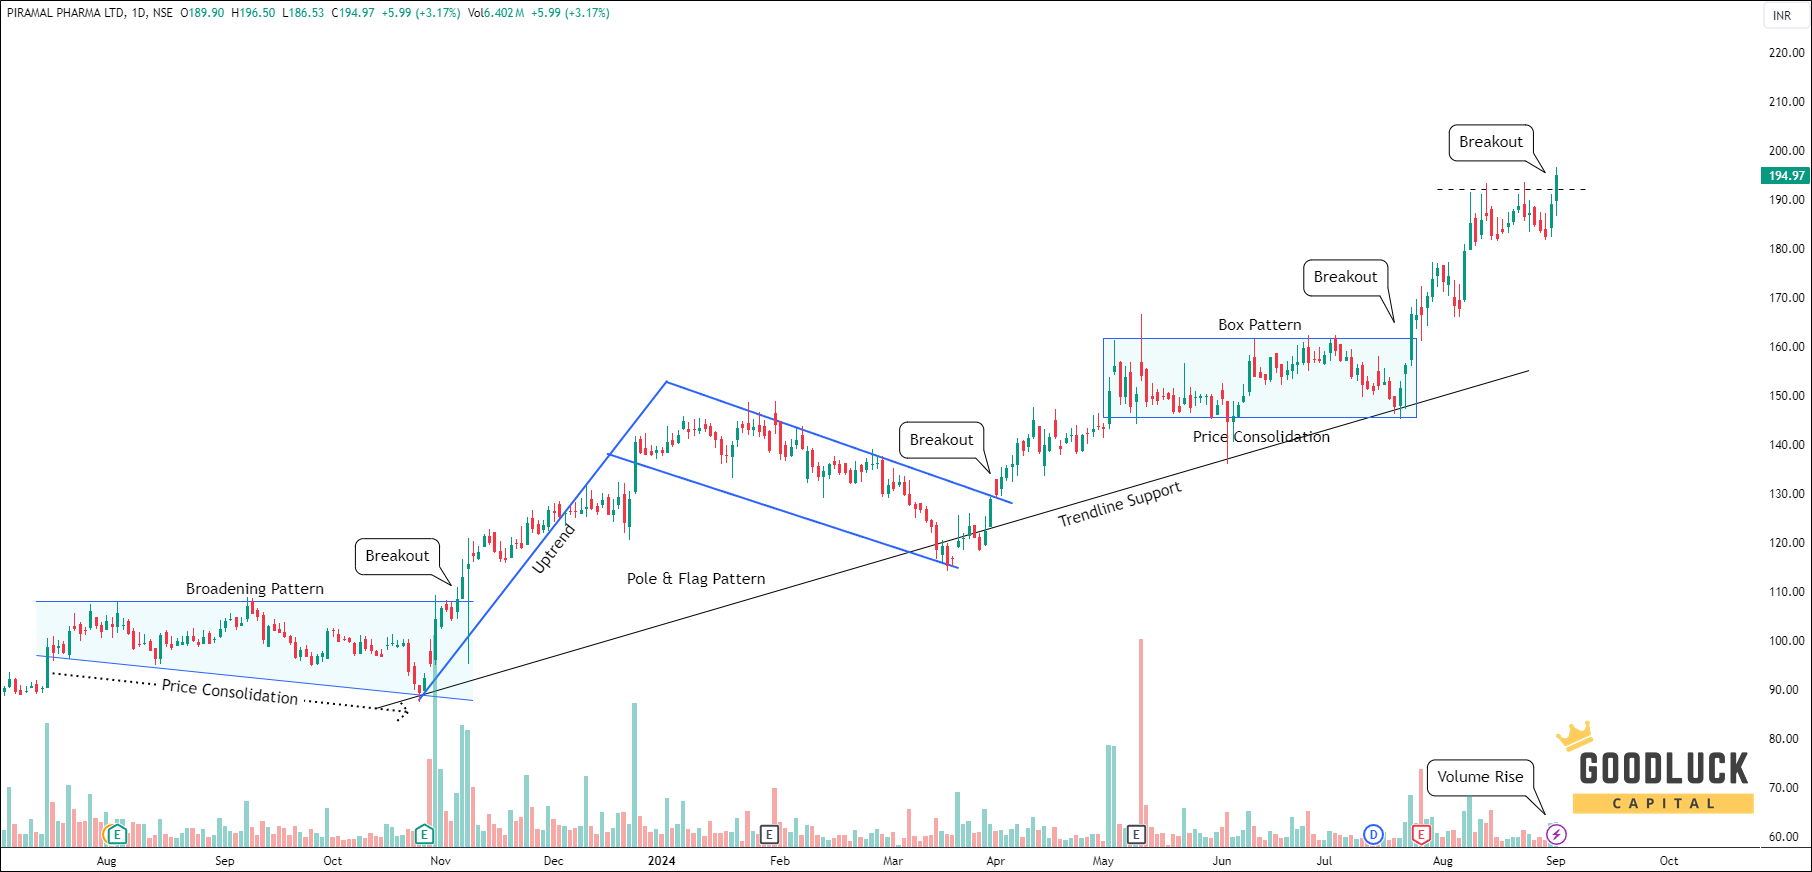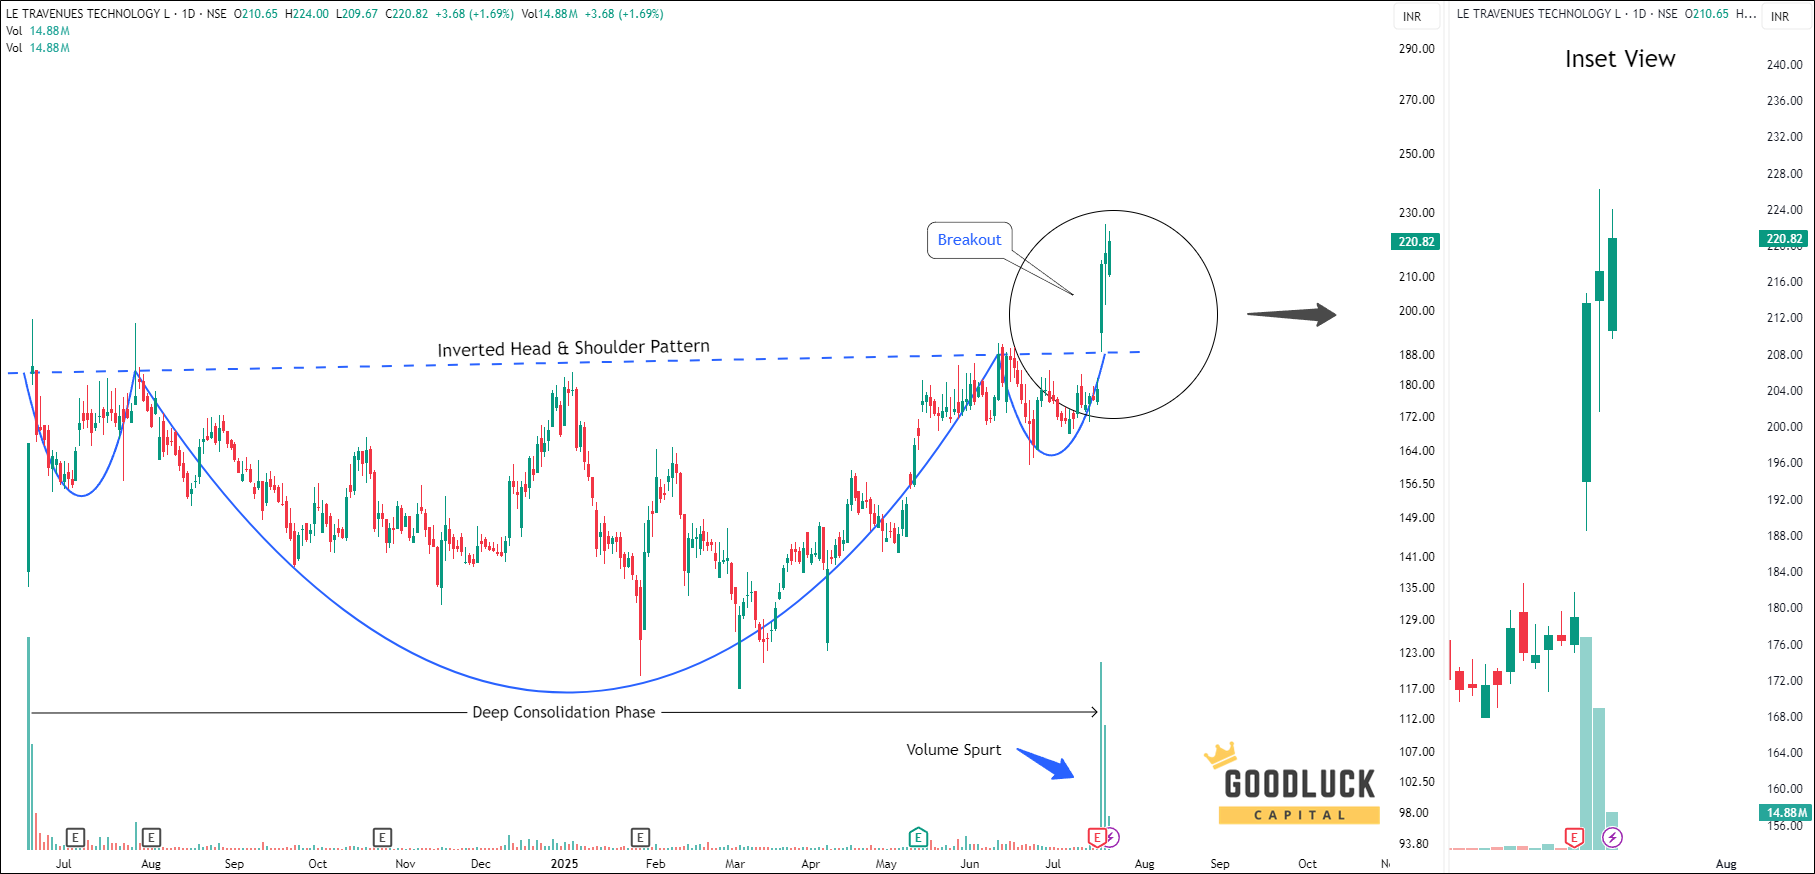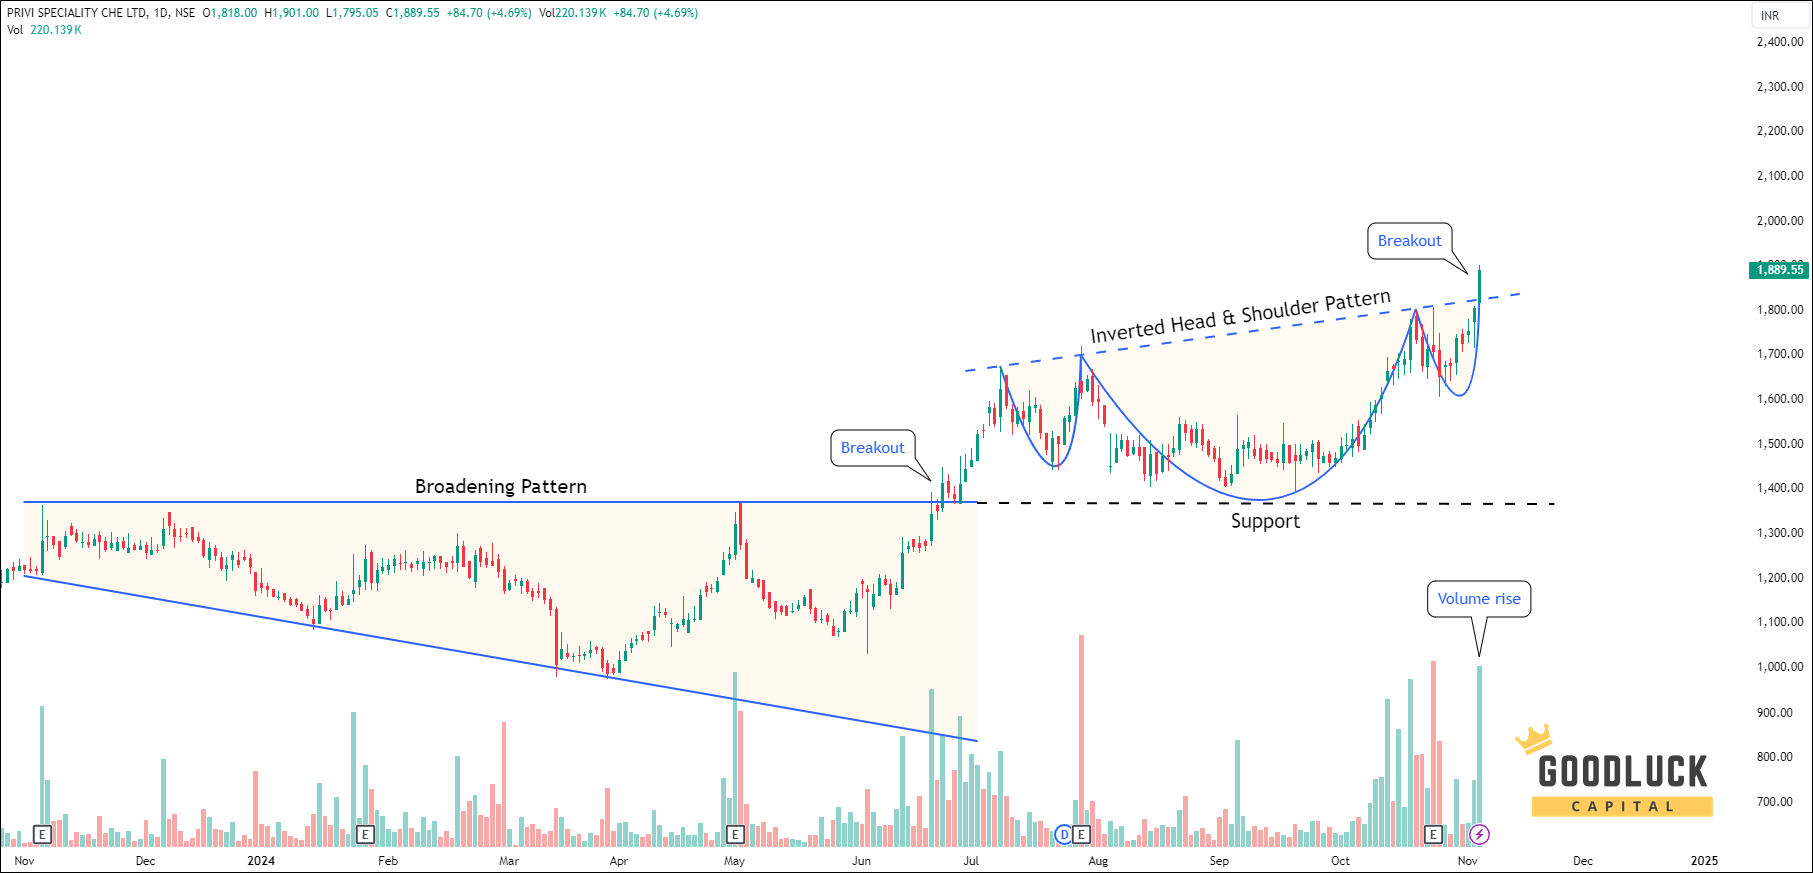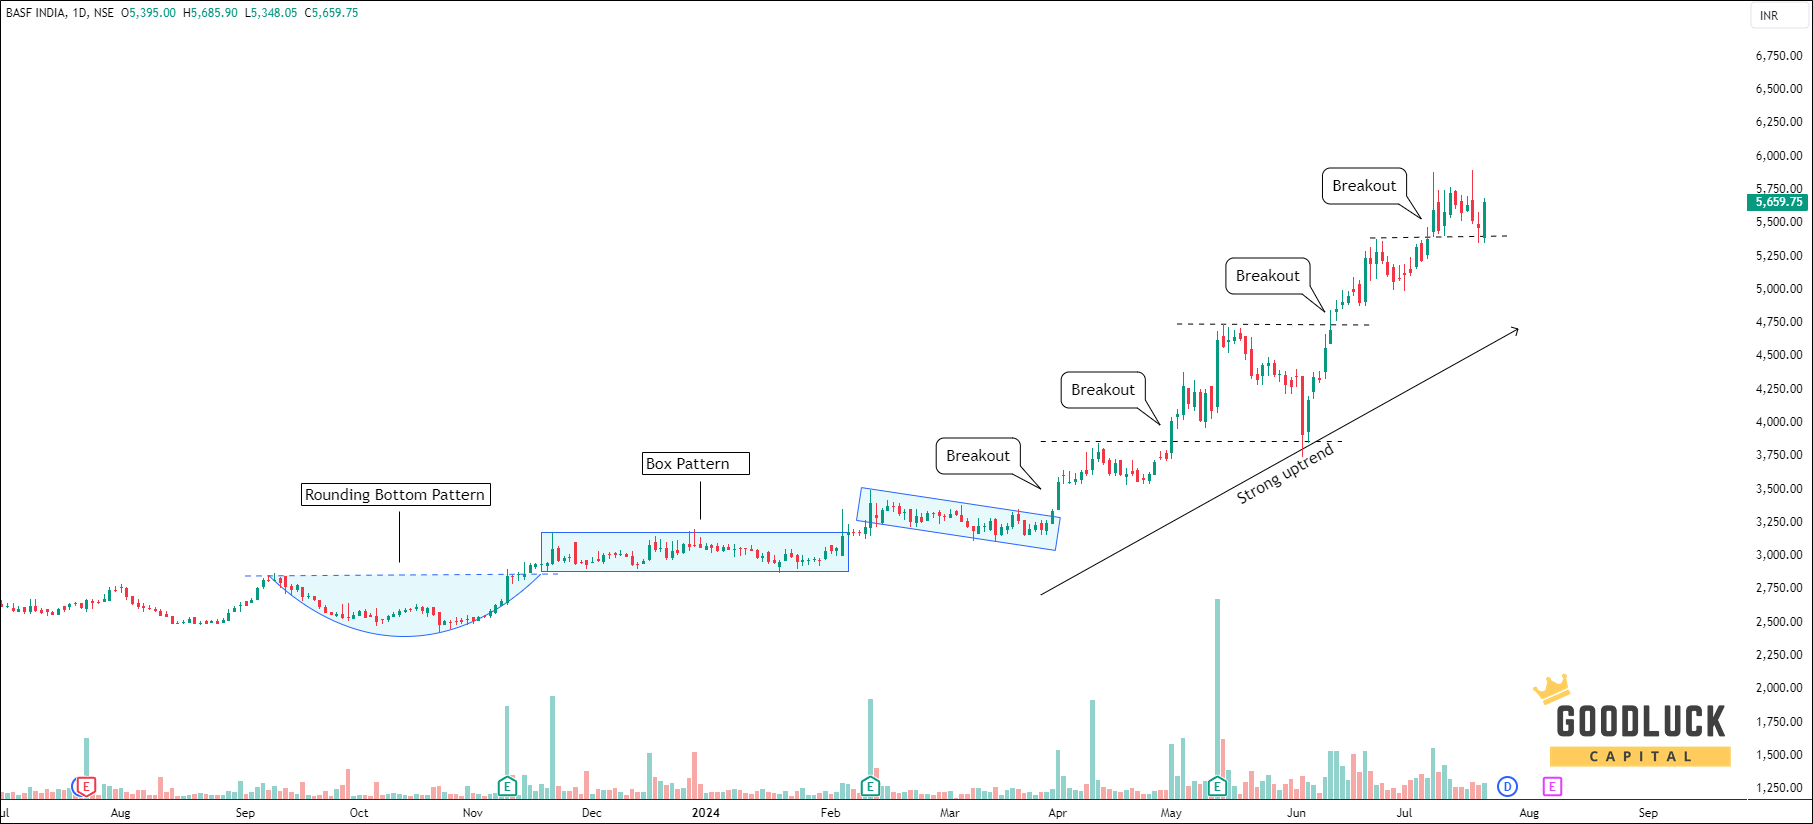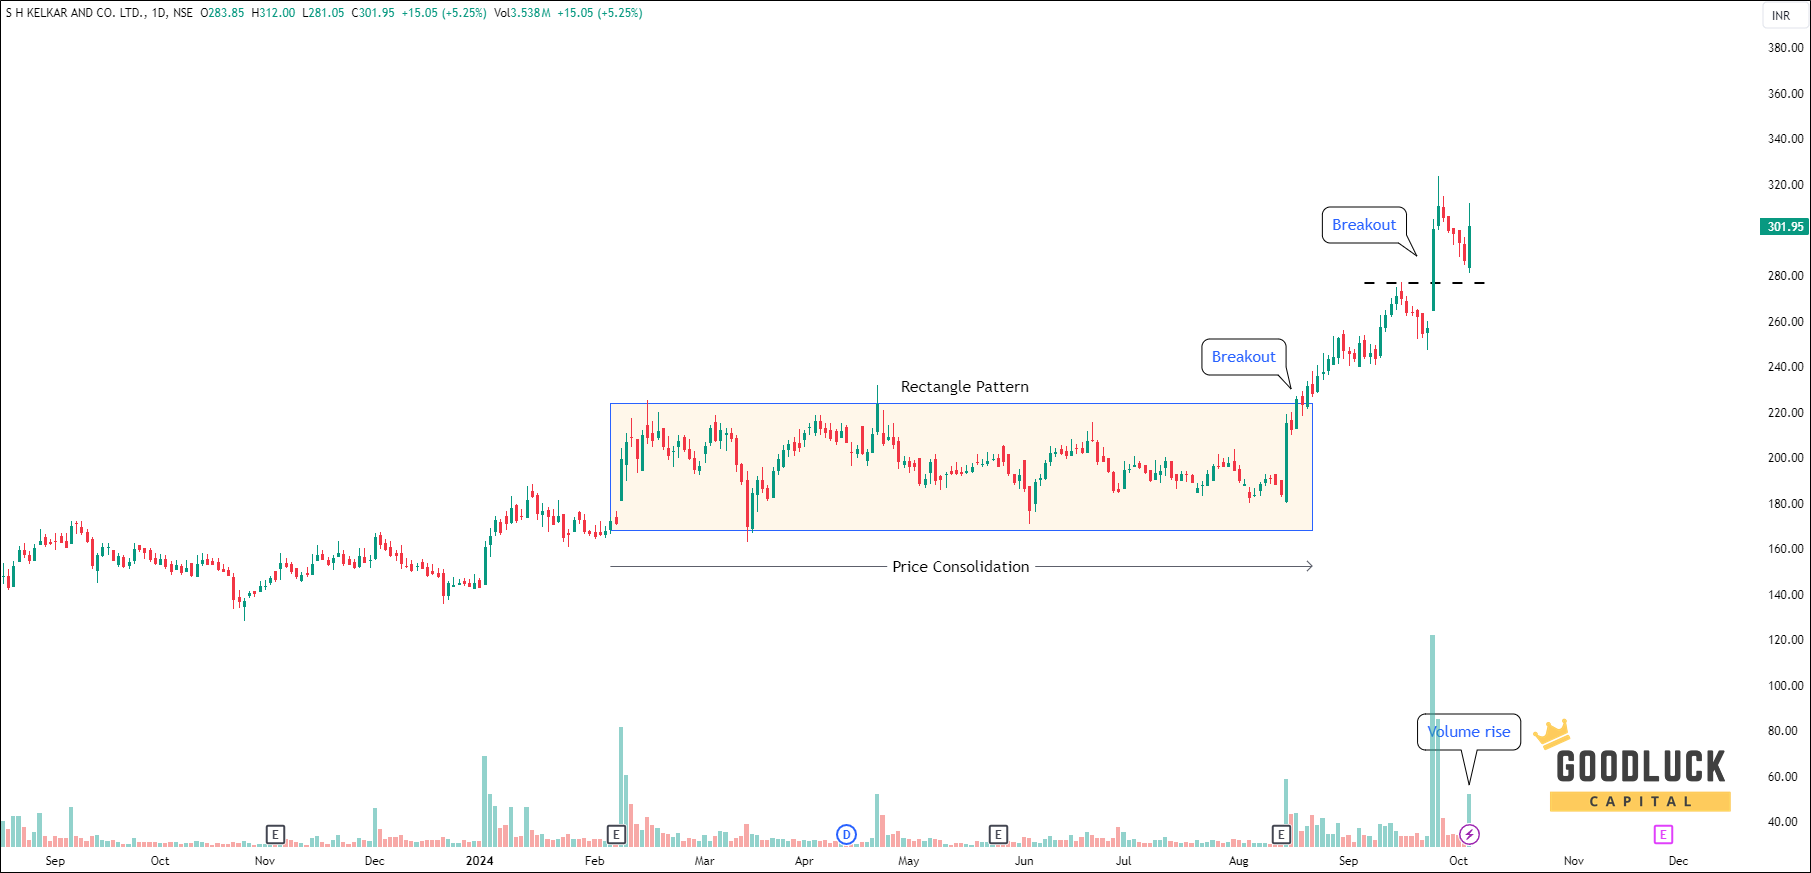
A stock finally breaks above a level it has struggled with for weeks. Everyone rushes in. Then, a few days later, the price slips back down to that same level, and the new buyers start to panic.
Many of them sell right there. And then the stock bounces and rallies far higher.
That dip back to the breakout level has a name: the retest. Understanding it can change how you enter, and where you place your stop-loss.
Identifying these opportunities requires patience and a clear understanding of price movements. Traders following positional calls Indian stock market opportunities often look for breakouts, support levels, and successful retests before entering a trade. Waiting for confirmation can help avoid chasing prices after a sharp rally.
What Is a Retest?
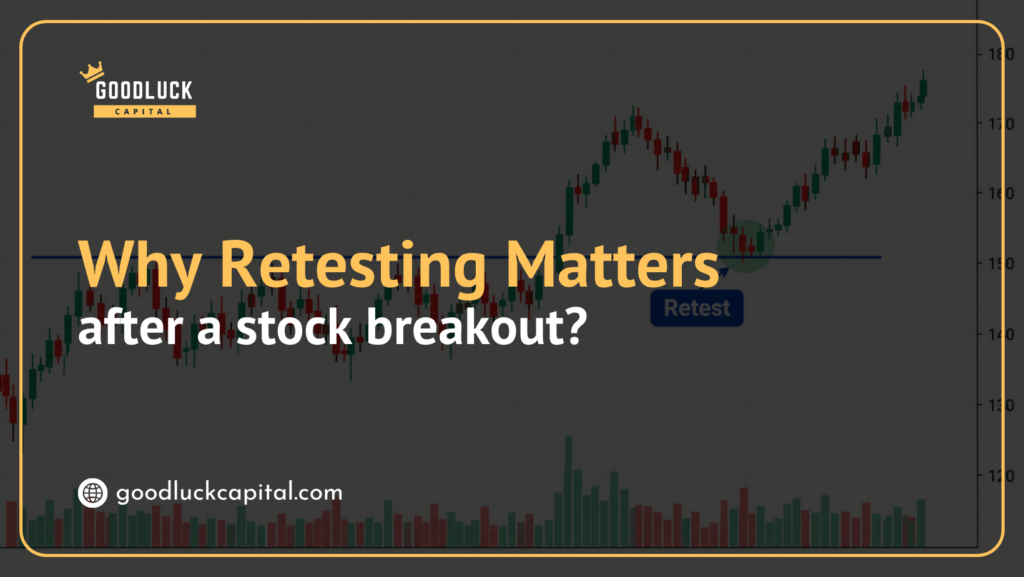
After a stock breaks above resistance, it often drifts back down to test that level from above. This pullback is the retest.
Here’s the key idea. The old resistance, which used to cap the stock, can now turn into support, which holds it up. Traders call this a role reversal.
Think of a building. The ceiling you broke through becomes the floor of the next room. The retest is the stock checking whether that new floor can actually hold its weight.
Why Does a Retest Happen?
A few simple things cause it:
- Profit booking. Early buyers cash in after the first jump, which pushes the price down for a while.
- Stuck sellers get relief. People who bought higher and waited months to break even finally sell as the price returns to their level.
- Late buyers wait. Many traders missed the breakout and don’t want to chase. They place orders near the old level, hoping for a better entry.
When those waiting buyers step in at the old resistance, that’s what turns it into support.
Why a Retest Matters
It’s a second proof. A breakout shows buyers can push through a level. A retest shows they will defend it. A level that holds when tested is a stronger signal than a breakout alone.
It gives a better price. Buying near the breakout level instead of after the jump usually means a smaller risk for the same target.
It exposes fakeouts early. If the level fails on the retest, you find out quickly, and your loss stays small.
It gives you a clear stop-loss. The level itself becomes your reference point. If the price falls decisively below it, your idea was wrong.
A Worked Example
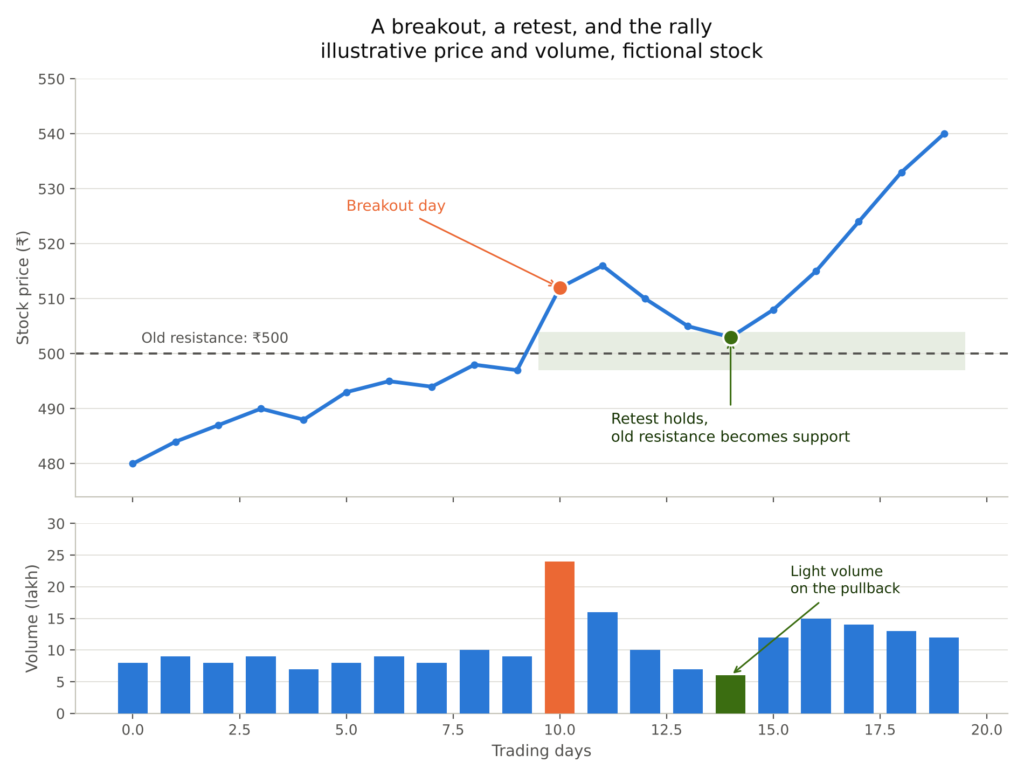
Let’s imagine a fictional stock with resistance at ₹500. It breaks out and closes at ₹512 on strong volume. A few days later, it dips back to about ₹503, holds the level, and rallies toward ₹560.
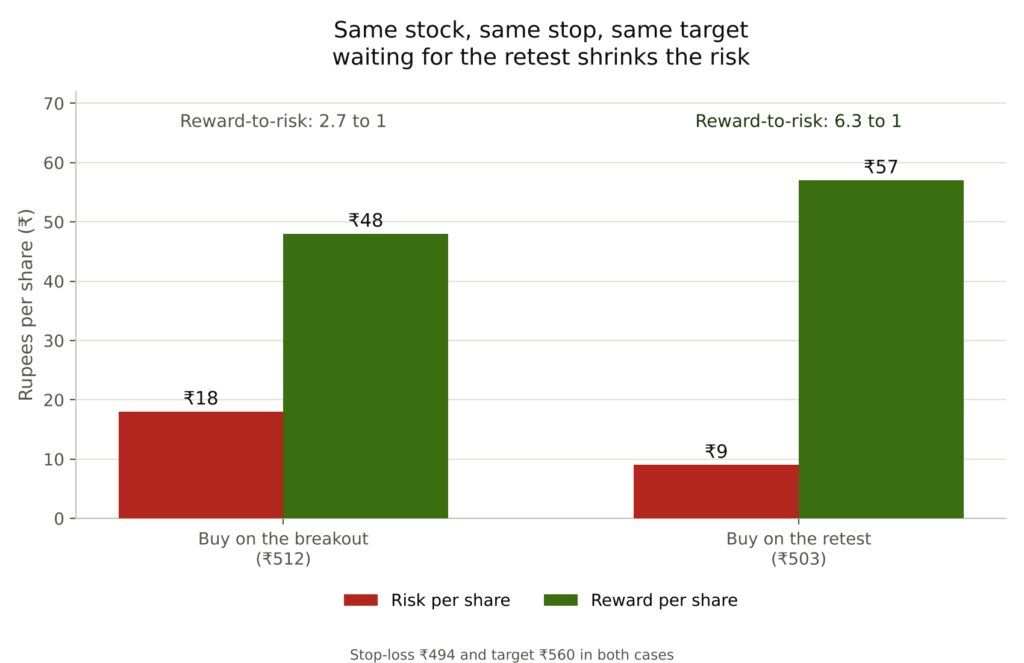
Compare two ways of entering. In both cases, the stop-loss is ₹494, just below the old resistance, and the target is ₹560.
| Entry | Entry price | Risk per share | Reward per share | Reward-to-risk |
|---|---|---|---|---|
| Buy on the breakout | ₹ 512 | ₹ 18 | ₹ 48 | 2.7 to 1 |
| Buy on the retest | ₹ 503 | ₹ 9 | ₹ 57 | 6.3 to 1 |
Same stock, same stop, same target. Waiting for the retest cut the risk in half and more than doubled the reward-to-risk ratio.
What a Healthy Retest Looks Like
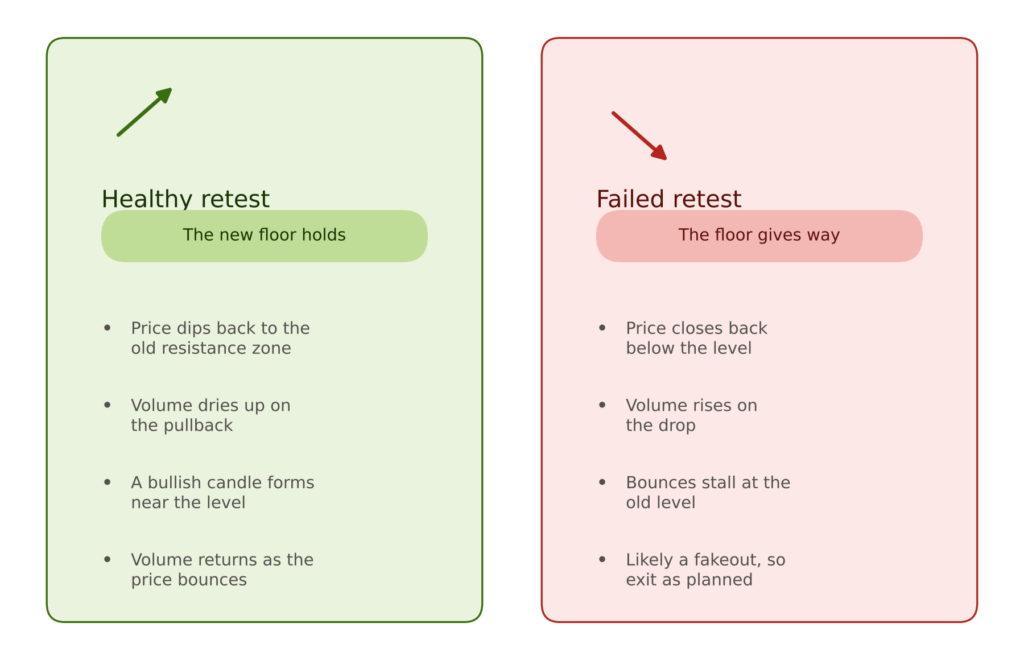
Not every pullback is a good retest. Here’s what you want to see:
- Price returns to the old resistance zone. Think of it as a zone, not an exact line.
- Volume dries up on the pullback. Light volume suggests sellers aren’t aggressive.
- A bullish candle forms near the level. A long lower wick or a strong green close shows buyers stepping in.
- The bounce picks up volume. Rising volume as the stock moves up again is a good sign.
- Delivery percentage stays healthy. In Indian markets, steady delivery on the bounce days suggests real investors, not just intraday traders.
What a Failed Retest Looks Like
Sometimes the old level doesn’t hold.
- Price closes back below the level. One brief dip isn’t a failure, but a decisive close underneath is.
- Volume rises on the drop. Heavy selling means sellers are in control.
- Bounces stall at the old level. The level that was meant to be support now acts as resistance again.
In that case, the breakout was likely a fakeout, and the right move is to exit as planned.
Not Every Breakout Gets a Retest
Strong stocks sometimes take off and never look back. If you wait for a retest that doesn’t come, you can miss a good move.
That’s an acceptable cost. Chasing a stock after it’s already run up leaves you with a large risk and a small reward. Some traders handle this by buying a small portion on the breakout and adding more on a successful retest. Others simply accept missed trades and wait for the next setup.
A Simple Retest Checklist
- Mark the old resistance level on your chart, as a zone.
- Wait for the price to come back, rather than chasing the breakout.
- Look for light volume on the pullback and a bullish candle near the level.
- Place your stop-loss just below the zone.
- Check that your reward-to-risk is still at least 2 to 1.
- Watch for result dates and big announcements. In India, a stock can gap past your stop overnight.
Consistently identifying such setups requires regular chart monitoring, technical research, and disciplined execution. Investors who prefer research-backed market guidance can explore a short term stock advisor India service to understand potential trading opportunities, entry levels, targets, and associated risks.
Conclusion
A breakout is a claim. A retest is the proof.
When a stock breaks out, it’s telling you buyers have won. When it comes back to that level and holds, it’s showing you the win wasn’t a fluke. Patience for that second look often earns you a better price, a smaller risk, and a much clearer sign of when you’re wrong.