A friend tells you about an investment that promises 3% every month, guaranteed, no risk at all. Before you get excited, here’s a rule worth remembering: if it sounds too good to be true, the risk didn’t disappear. It just got hidden from you.
This is especially important when following positional calls Indian stock market investors receive from advisors, analysts, or online platforms. A stock idea can have strong return potential, but that potential always comes with some level of risk. Understanding that trade-off is more important than simply looking at the expected return.
What Does “Risk vs Reward” Really Mean?
Every investment carries some chance that you could lose money. That’s risk. In exchange for taking on that risk, you expect a shot at earning more than you would from a completely safe option. That’s reward.
Think of it like a see-saw. Push down on one side, chasing higher returns, and the other side, risk, naturally rises with it. You can’t push potential reward up without risk following along. Anyone offering you high reward while insisting the risk side stays flat isn’t describing a real investment.
Why “No Risk, High Reward” Is Almost Always a Warning Sign
Fixed deposits, PPF, and government bonds are genuinely low risk, and they offer correspondingly modest returns. If someone offers a return far above what these safe options pay, with no real risk attached, one of two things is usually true: either the risk is being hidden from you, or the scheme isn’t going to pay out the way it claims.
India has seen this story play out many times, from chit fund collapses to Ponzi schemes promising unrealistic guaranteed monthly returns. The math never actually changes. Only the story around it does.
The Risk-Reward Ladder in Indian Investing
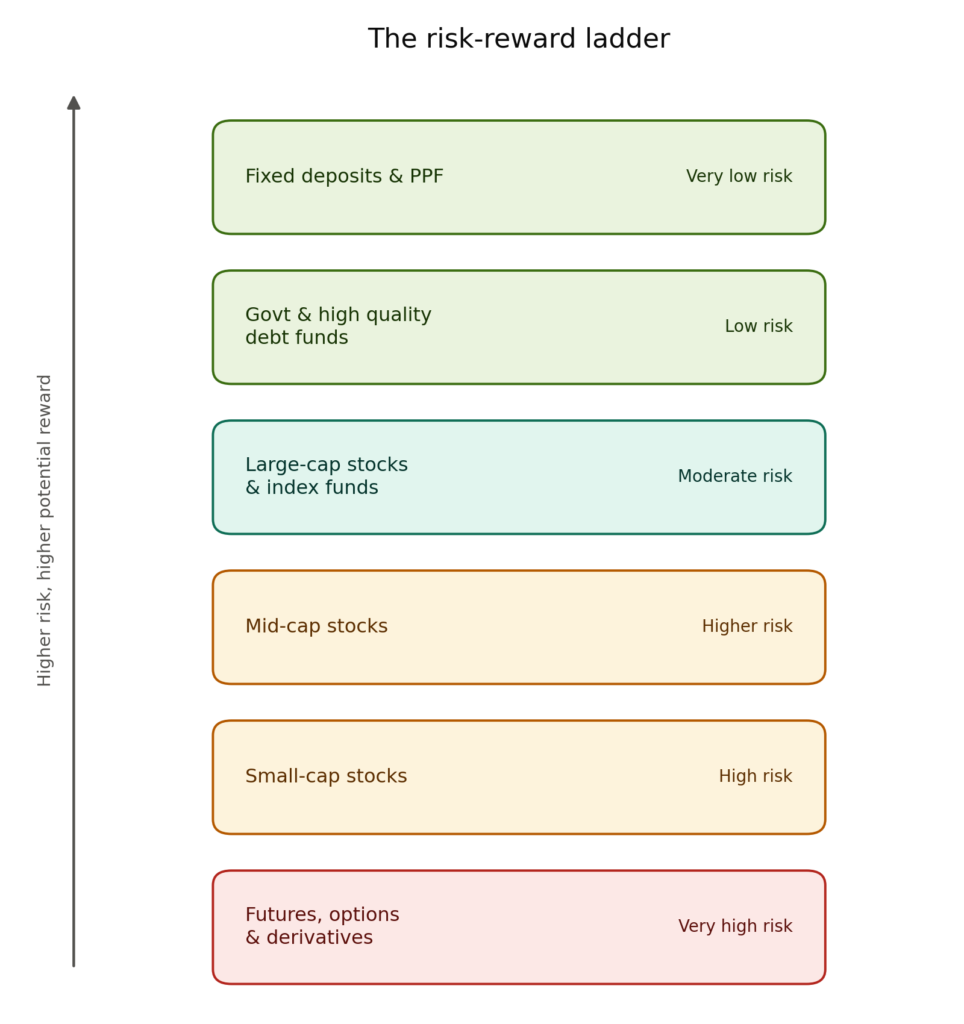
Think of Indian investment options as rungs on a ladder, from safest to riskiest.
- Fixed deposits and PPF. Very low risk, modest and predictable returns.
- Government and high quality debt funds. Low risk, slightly better returns than FDs.
- Large-cap stocks and index funds. Moderate risk, historically solid long-term returns.
- Mid-cap stocks. Higher risk, higher potential returns, with bigger swings along the way.
- Small-cap stocks. High risk, high potential returns, and the ability to fall sharply too.
- Futures, options, and other derivatives. Very high risk, with the potential for large gains or losses in a short time.
This isn’t a ranking of good to bad. Each rung has a place in a well built portfolio. What matters is knowing which rung you’re standing on, and whether it actually matches your goals.
The Risk-Reward Ratio: A Simple Trading Tool
Beyond asset classes, traders also use something called the risk-reward ratio to judge individual trades. It compares how much you stand to lose if a trade goes wrong against how much you stand to gain if it goes right.
Say you buy a stock at ₹500, planning to sell if it falls to ₹480, a ₹20 risk, or if it rises to ₹560, a ₹60 reward. That’s a risk-reward ratio of 1:3, meaning you’re risking ₹1 for every ₹3 you hope to gain. Many traders look for a ratio of at least 1:2 before entering a trade, so that even if they’re wrong more often than they’re right, the winners can still outweigh the losers.
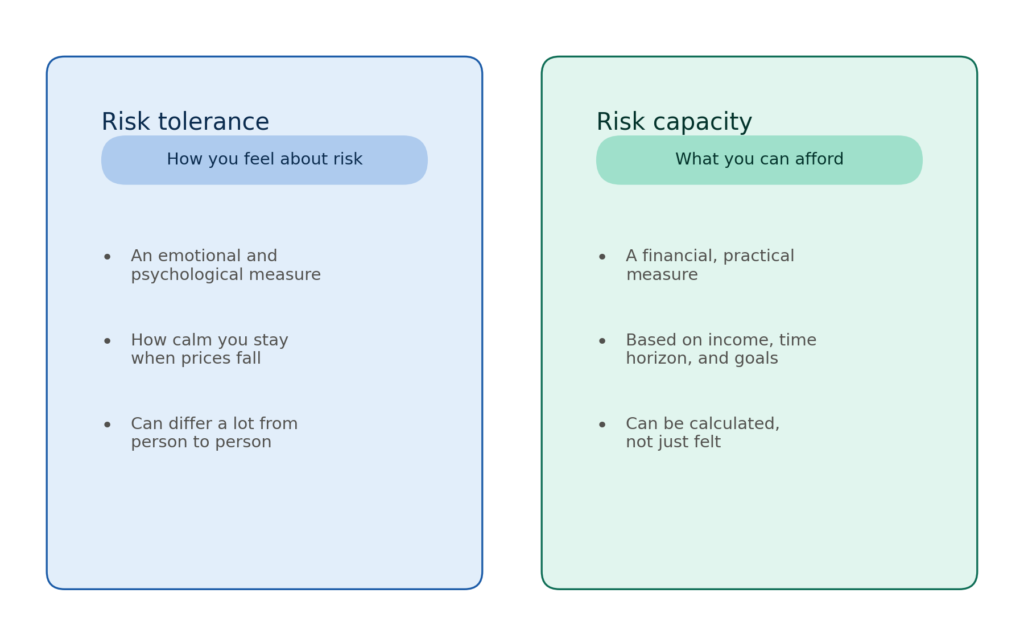
Risk Tolerance vs Risk Capacity
These two terms sound similar but mean very different things.
Risk tolerance is how much risk you’re emotionally comfortable with. Some people can watch their portfolio drop 20% and sleep just fine. Others panic at a 5% dip.
Risk capacity is how much risk you can actually afford to take, based on your income, expenses, time horizon, and financial goals.
These two don’t always match. A 25-year-old with a stable job and no dependents might have high risk capacity, but if they panic and sell every time the market dips, their real risk tolerance is actually low. Building a portfolio that matches both, not just one, is what actually keeps people invested for the long run.
Three Investors, Three Different Journeys
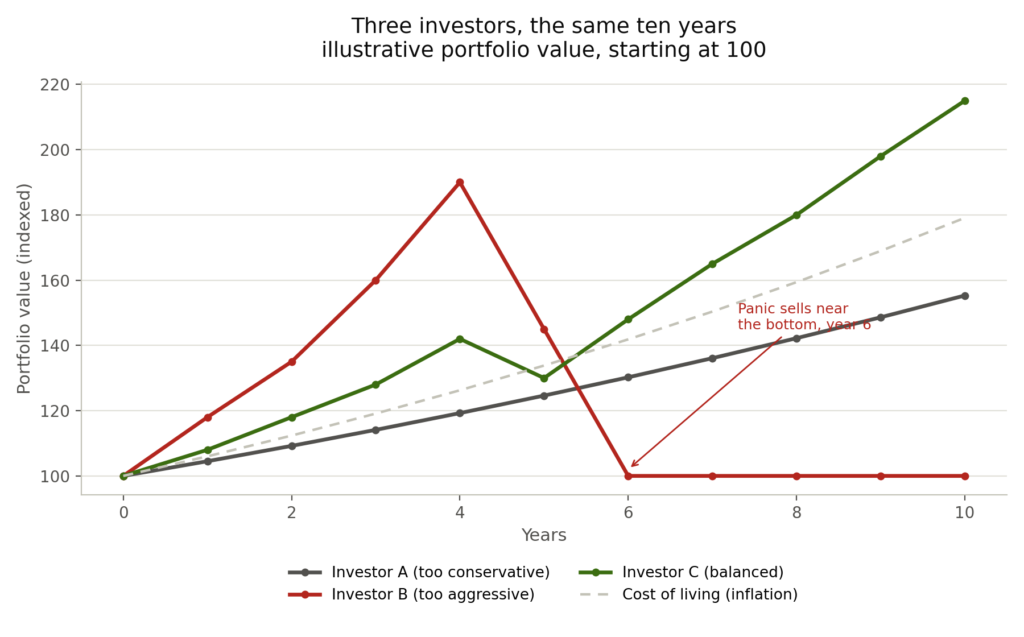
Let’s imagine three investors, each starting with the same amount of money, invested for ten years.
Investor A is too conservative, keeping almost everything in a savings account. Their money barely grows faster than inflation, so their real purchasing power barely improves at all.
Investor B is too aggressive, putting most of their money into small-cap stocks and derivatives. When the market drops sharply one year, panic sets in, and they sell everything near the bottom, locking in painful losses.
Investor C builds a balanced mix across large-caps, some mid-caps, and a portion in safer debt instruments. They ride out the dips without panicking and end the decade with steady, meaningful growth.
Practical Tips for New Investors
- Match your investments to your time horizon. Money you’ll need in a year shouldn’t sit in volatile small-cap stocks.
- Be honest about your risk tolerance, not just your risk capacity. The best portfolio is one you can actually stick with during a downturn.
- Diversify across the risk ladder instead of putting everything on one rung.
- Treat “guaranteed high returns” claims as a red flag, never as a bonus.
- When considering Swing stock trading tips in India, focus not only on the potential upside but also on the entry price, stop-loss level, position size, and realistic target.
Conclusion
Risk and reward will always move together, like two ends of the same see-saw. The goal was never to eliminate risk, that’s not realistic. The goal is understanding exactly how much risk you’re taking, and making sure it’s a level you can genuinely live with, both financially and emotionally, for as long as it takes to see the reward.