
Two years ago, IT stocks were the stars of the Nifty. Investors couldn’t stop talking about them. Today, the spotlight has moved to banks and autos, while IT quietly sits in the background. This isn’t random. It’s called sector rotation, and once you understand how it works, you’ll start noticing it everywhere.
For investors using SEBI registered trading advisory in India, understanding sector rotation can be especially useful. It provides a broader view of where market momentum is shifting and which sectors may have a better chance of leading the next move.
What Is Sector Rotation, Really?
Sector rotation is the pattern of money moving from one industry group to another as the economy moves through different phases. It’s the market’s version of a relay race. One sector carries the baton for a while, then hands it off to the next as conditions change.
No single sector stays on top forever. Banks lead for a while, then autos take over, then FMCG and pharma get their turn. Understanding where we are in this race can help you spot which sector might be about to take the lead next.
The Economic Cycle and Why Sectors Take Turns
The economy moves in cycles: slowdown, recovery, growth, and overheating, before slowing down again. Different sectors are built to perform well at different points in this cycle.
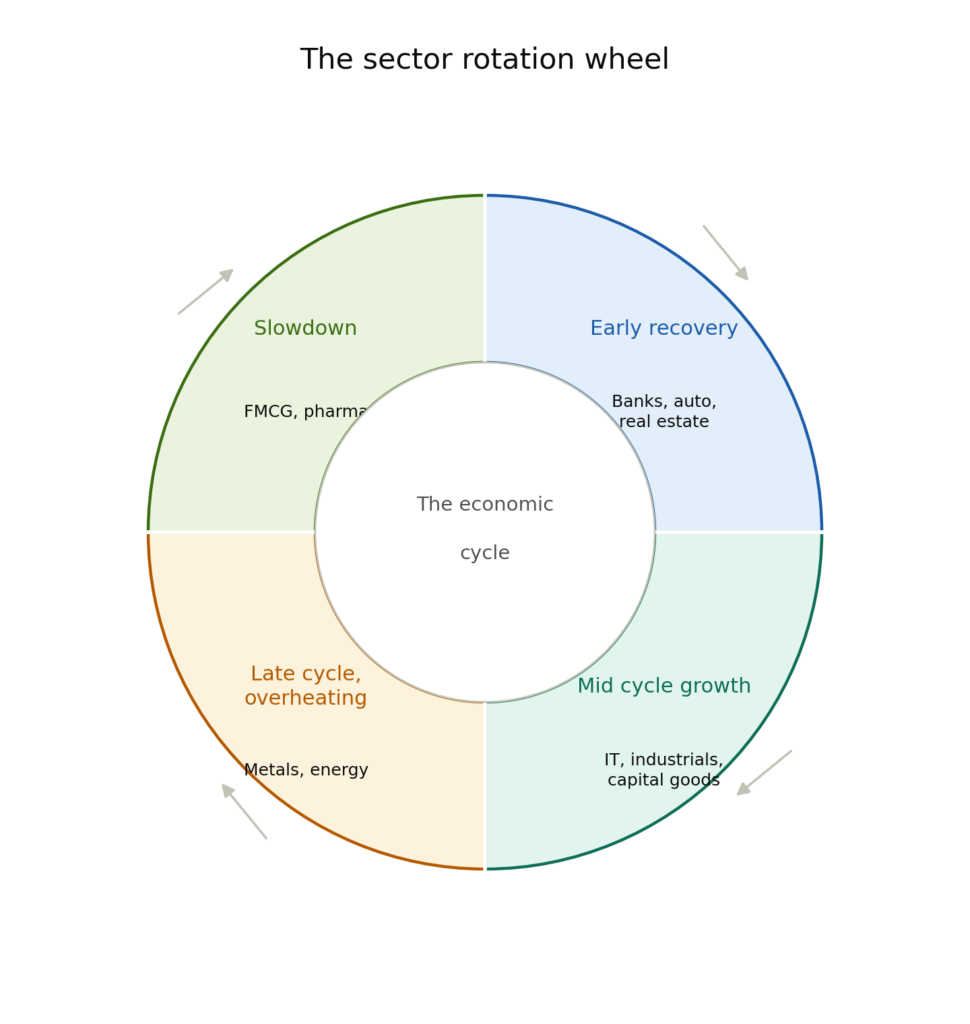
Early recovery. When the economy is just pulling out of a slump and interest rates are low, banks, auto companies, and real estate firms often lead. Cheaper loans mean more people buy homes and cars, and banks benefit from a wave of fresh lending.
Mid cycle growth. As the economy gathers steam, companies start expanding and investing again. This often favors capital goods, industrials, and IT companies, since businesses spend more on technology, equipment, and expansion.
Late cycle, overheating. As growth peaks and inflation creeps up, commodity linked sectors like metals and energy often take the lead. These businesses tend to benefit when prices across the economy are rising.
Slowdown. When growth cools and uncertainty rises, investors often shift toward defensive sectors like FMCG and pharma. People still buy soap, food, and medicine no matter how the economy is doing, so these businesses hold up better when everything else wobbles.
How to Spot Rotation Happening
- Watch sector indices, not just the Nifty. If Nifty Bank or Nifty Auto starts quietly outperforming the broader Nifty 50, that’s often an early clue.
- Track where big institutional money is flowing. FIIs and mutual funds often start shifting positions before the change becomes obvious to everyone else.
- Compare relative strength. A sector that keeps making new highs relative to the Nifty, even when the index itself is flat, is often building leadership.
- Notice when yesterday’s winners start lagging. Rotation often shows up first as fading momentum in last year’s favorite sector, before this year’s leader becomes obvious.
Two Years, Two Leaders
Let’s look at two contrasting years.
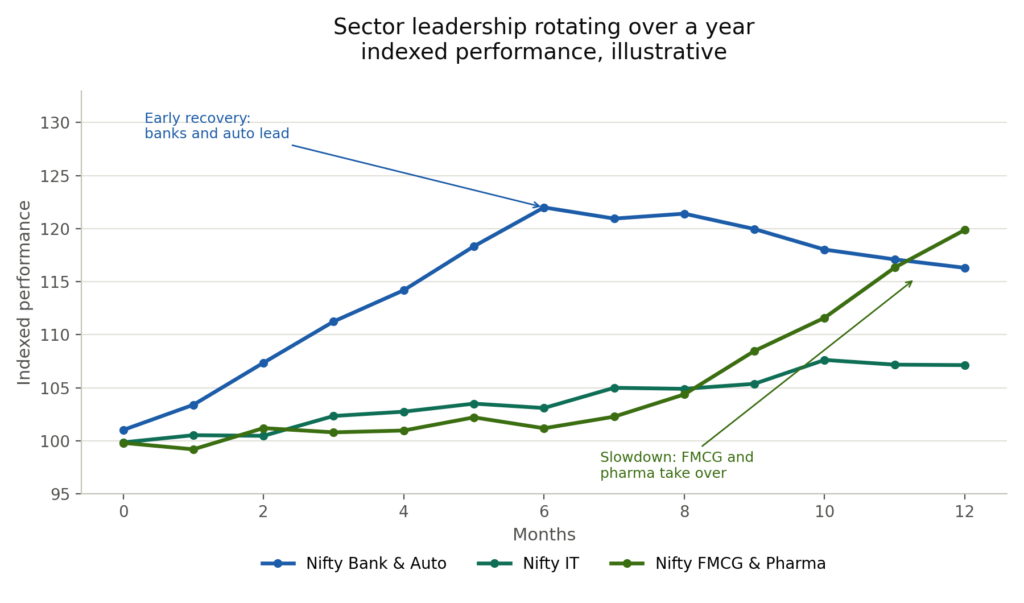
In Year One, the economy is just coming out of a slowdown. Interest rates have been cut, credit is flowing again, and Nifty Bank and Nifty Auto post strong gains, comfortably beating the Nifty 50. IT stocks, meanwhile, barely move.
In Year Two, growth has peaked and inflation worries creep in. Investors grow cautious. This time, Nifty FMCG and Nifty Pharma lead the pack, while Nifty Bank and Nifty Auto, last year’s stars, cool off considerably.
| Phase | Leading Sectors | Lagging Sectors |
|---|---|---|
| Early recovery | Banks, auto, real estate | Defensive sectors like FMCG |
| Mid cycle growth | IT, industrials, capital goods | Commodity linked sectors |
| Late cycle, overheating | Metals, energy | Rate sensitive sectors like banks |
| Slowdown | FMCG, pharma | Cyclical sectors like auto, realty |
Cyclical Sectors vs Defensive Sectors
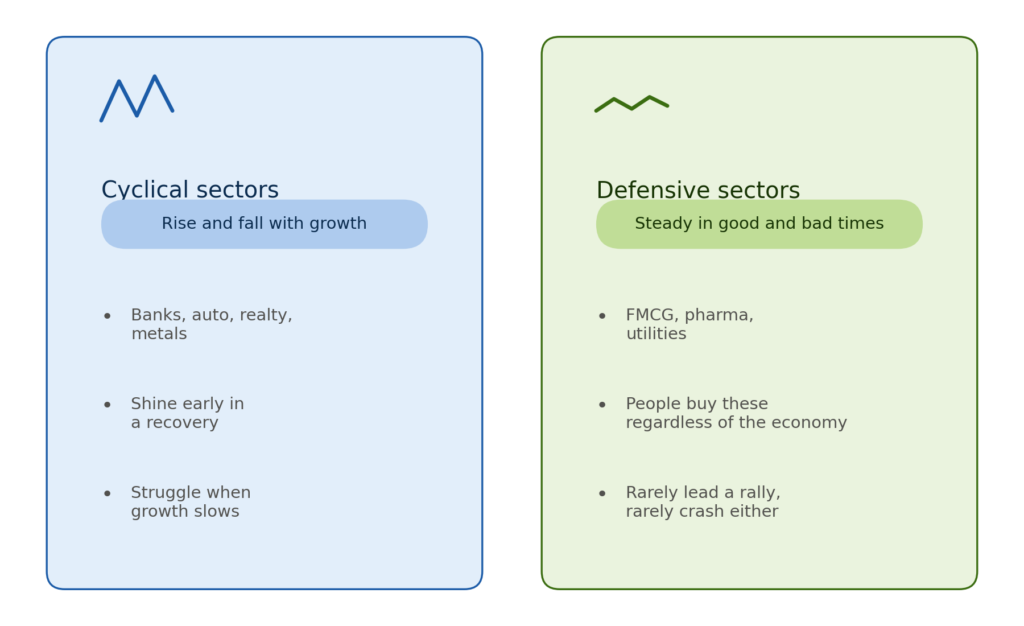
It helps to sort sectors into two broad buckets. Cyclical sectors, like banks, autos, realty, and metals, rise and fall with the broader economy. They tend to shine early in a recovery and struggle when growth slows.
Defensive sectors, like FMCG, pharma, and utilities, don’t swing as wildly either way. People need soap, medicine, and electricity in good times and bad, so these sectors hold up steadier through the ups and downs, even if they rarely lead a rally by a huge margin.
Knowing which bucket a sector falls into makes it much easier to guess how it might behave as the cycle shifts.
What Investors Should Watch
- Don’t assume last year’s winning sector will keep winning. Leadership rotates, often earlier than expected.
- Use sector indices as a compass, not a certainty. Rotation hints at what might come next, it doesn’t guarantee it.
- Diversify across cyclical and defensive sectors so you’re never fully out of step with the cycle.
- Watch interest rate decisions and inflation data closely. These are often the triggers that kick off the next rotation.
For investors considering short term stock trading advisory services, sector rotation can also provide an important framework for identifying where momentum is building rather than simply chasing stocks that have already rallied.
Conclusion
Think of the market as a relay race with four runners: banks and autos, industrials and IT, metals and energy, and FMCG and pharma. Each one sprints hard for their leg of the race, then hands off the baton to the next.
Sector rotation won’t tell you exactly when the handoff happens. But if you’re watching closely, you’ll often see the next runner start warming up long before they’re handed the baton.