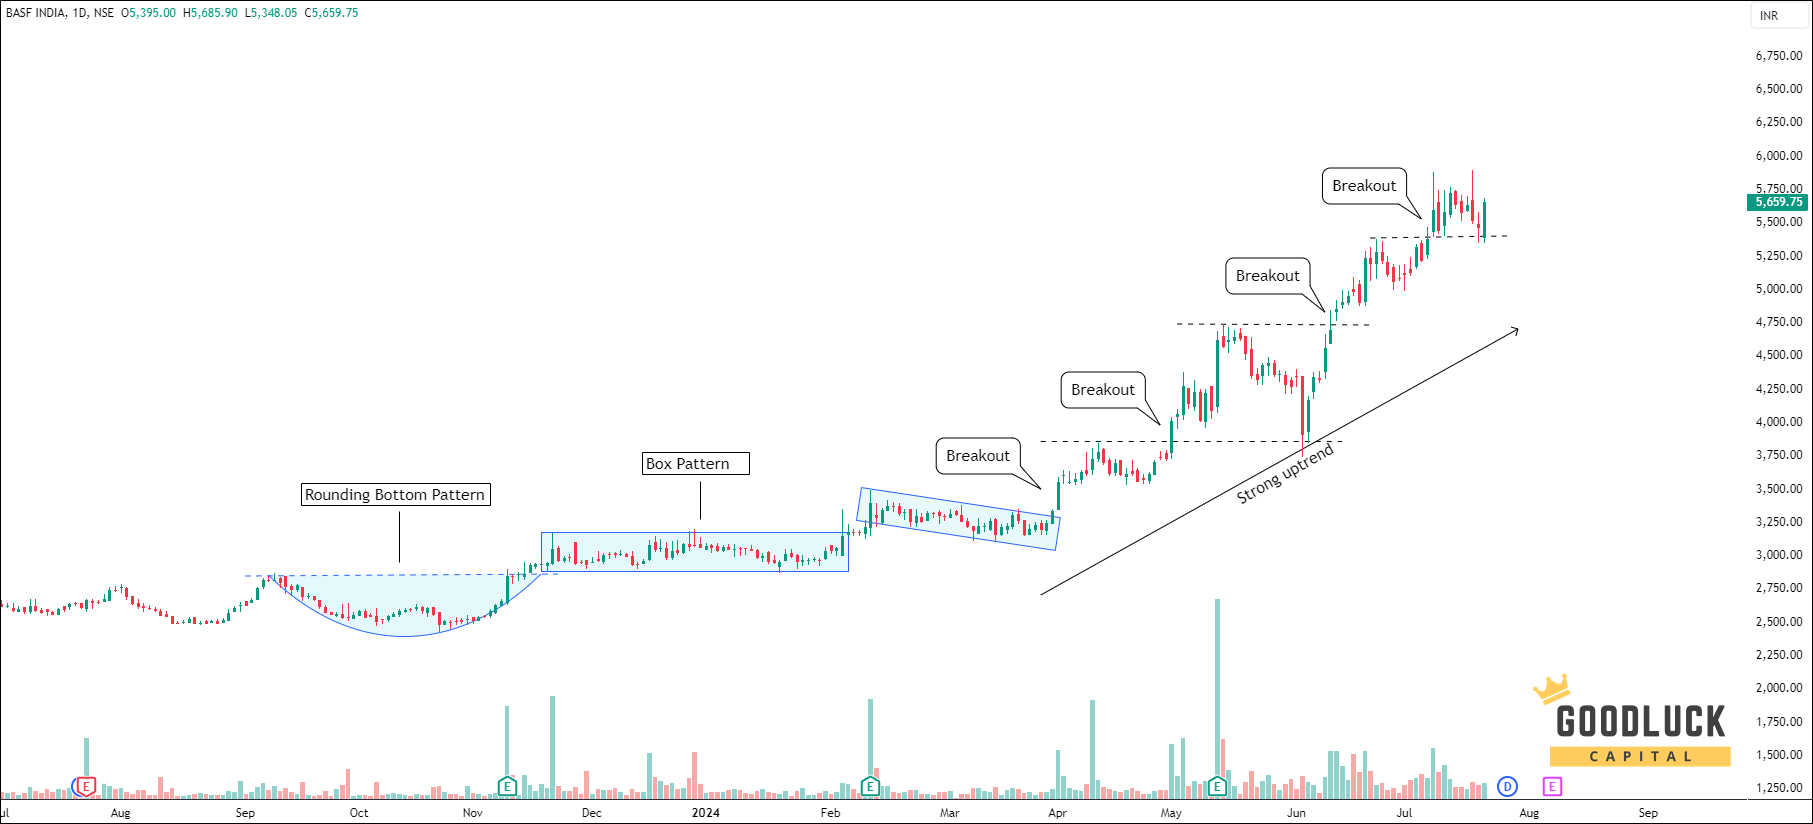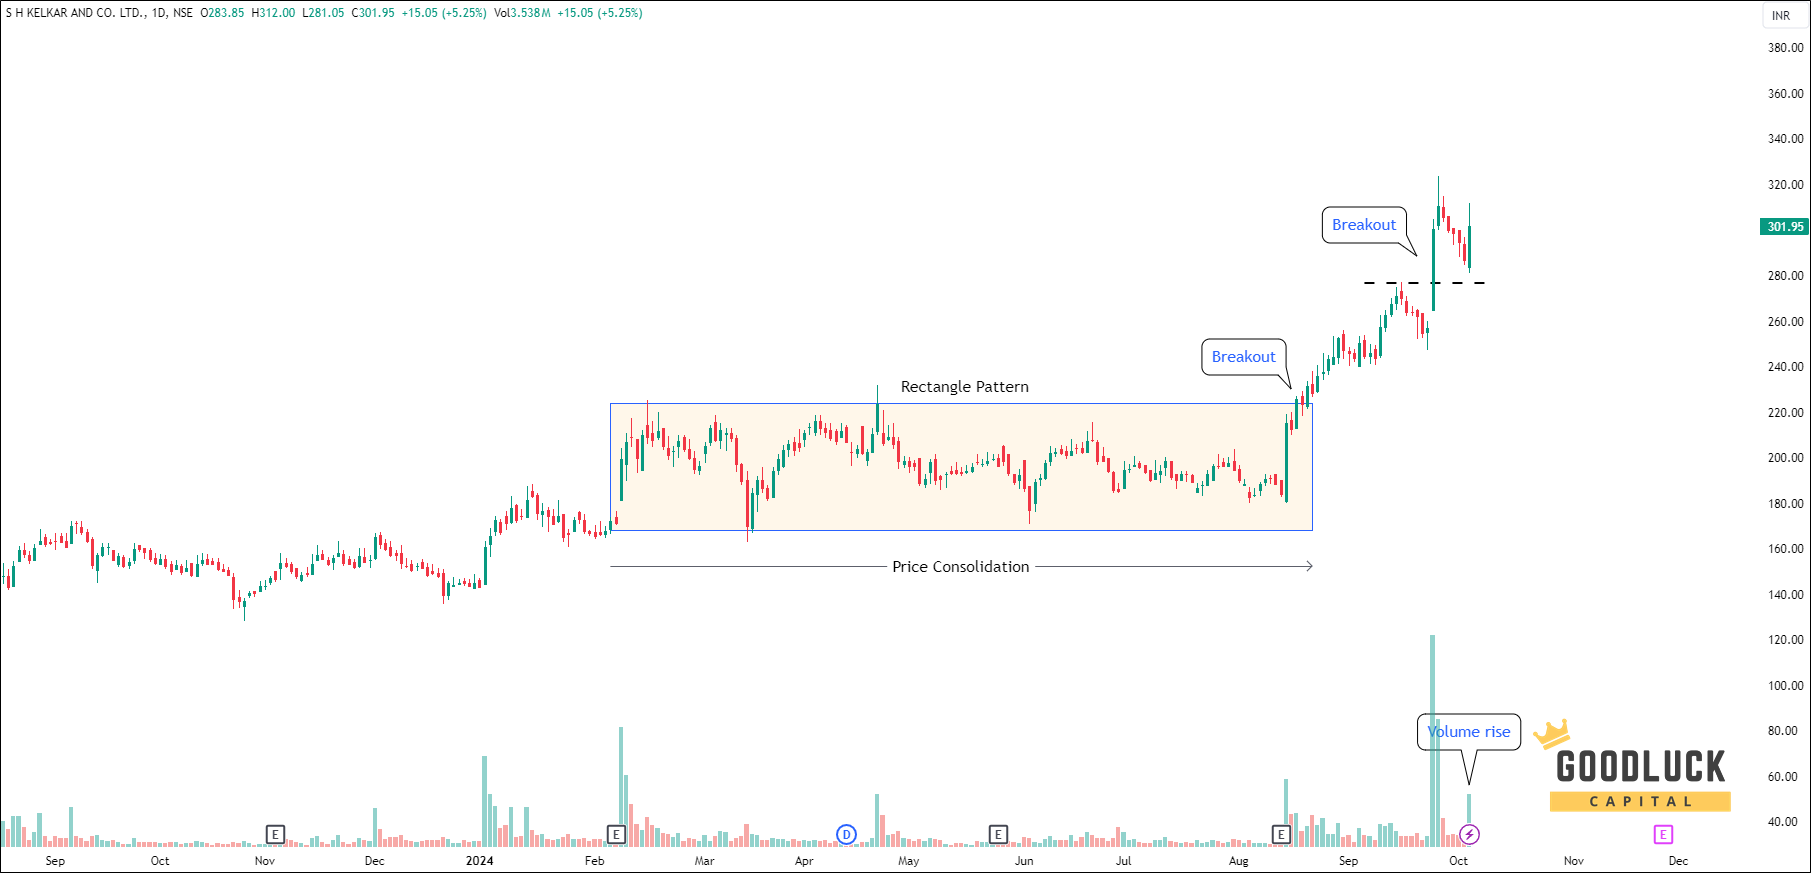
A stock breaks above a level it’s struggled to cross for weeks. Volume spikes, everyone’s excited, you jump in. Two hours later, the stock is back below that same level, and you’re sitting on a loss. Welcome to one of the most common traps in trading: the fakeout.
For traders looking for a short term trading opportunity, breakouts can be attractive because they can signal the start of a fresh price move. But not every breakout is genuine. Learning to separate real breakouts from fakeouts can help traders avoid entering too early and manage risk more effectively.
What Is a Breakout, Really?
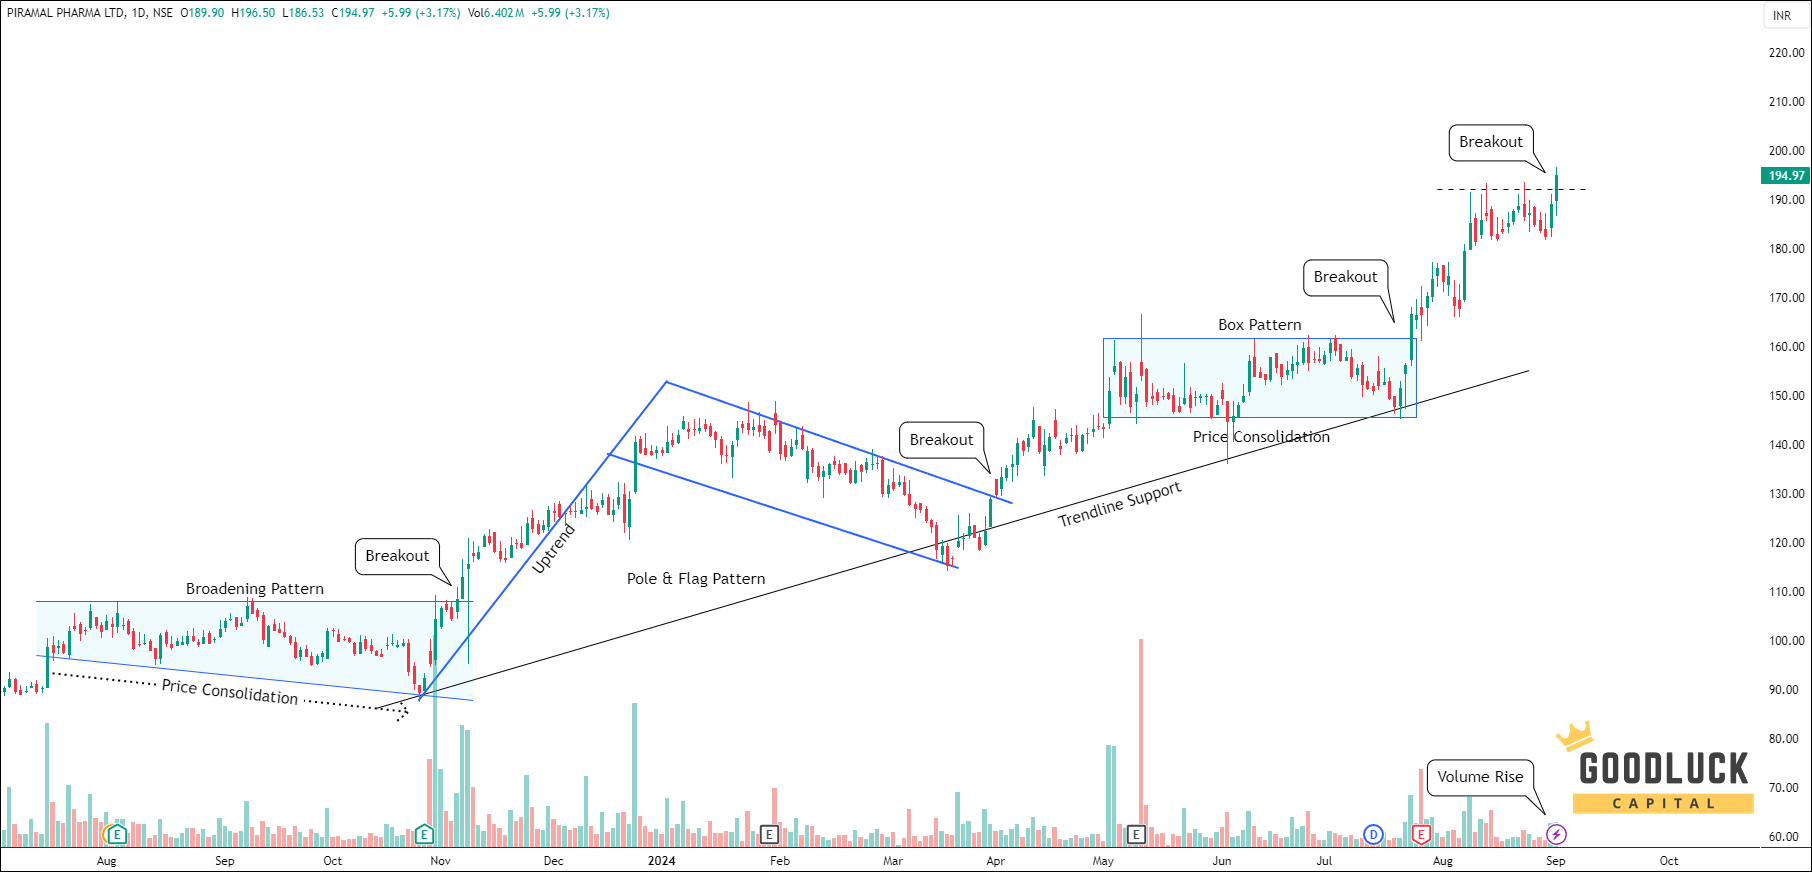
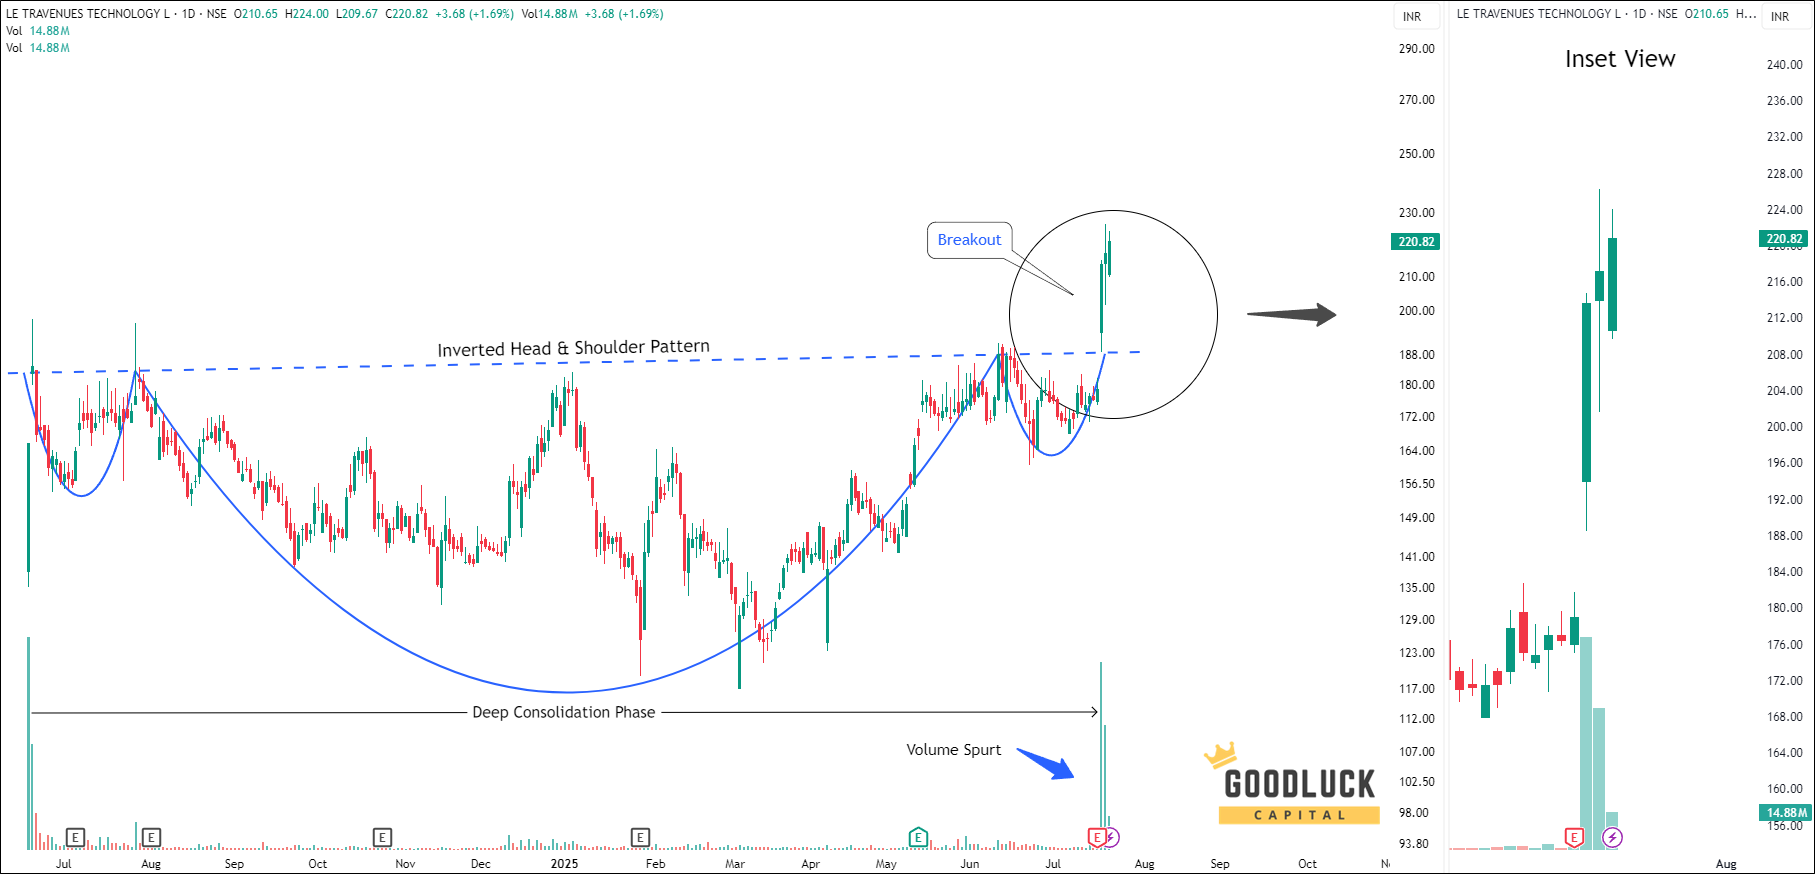
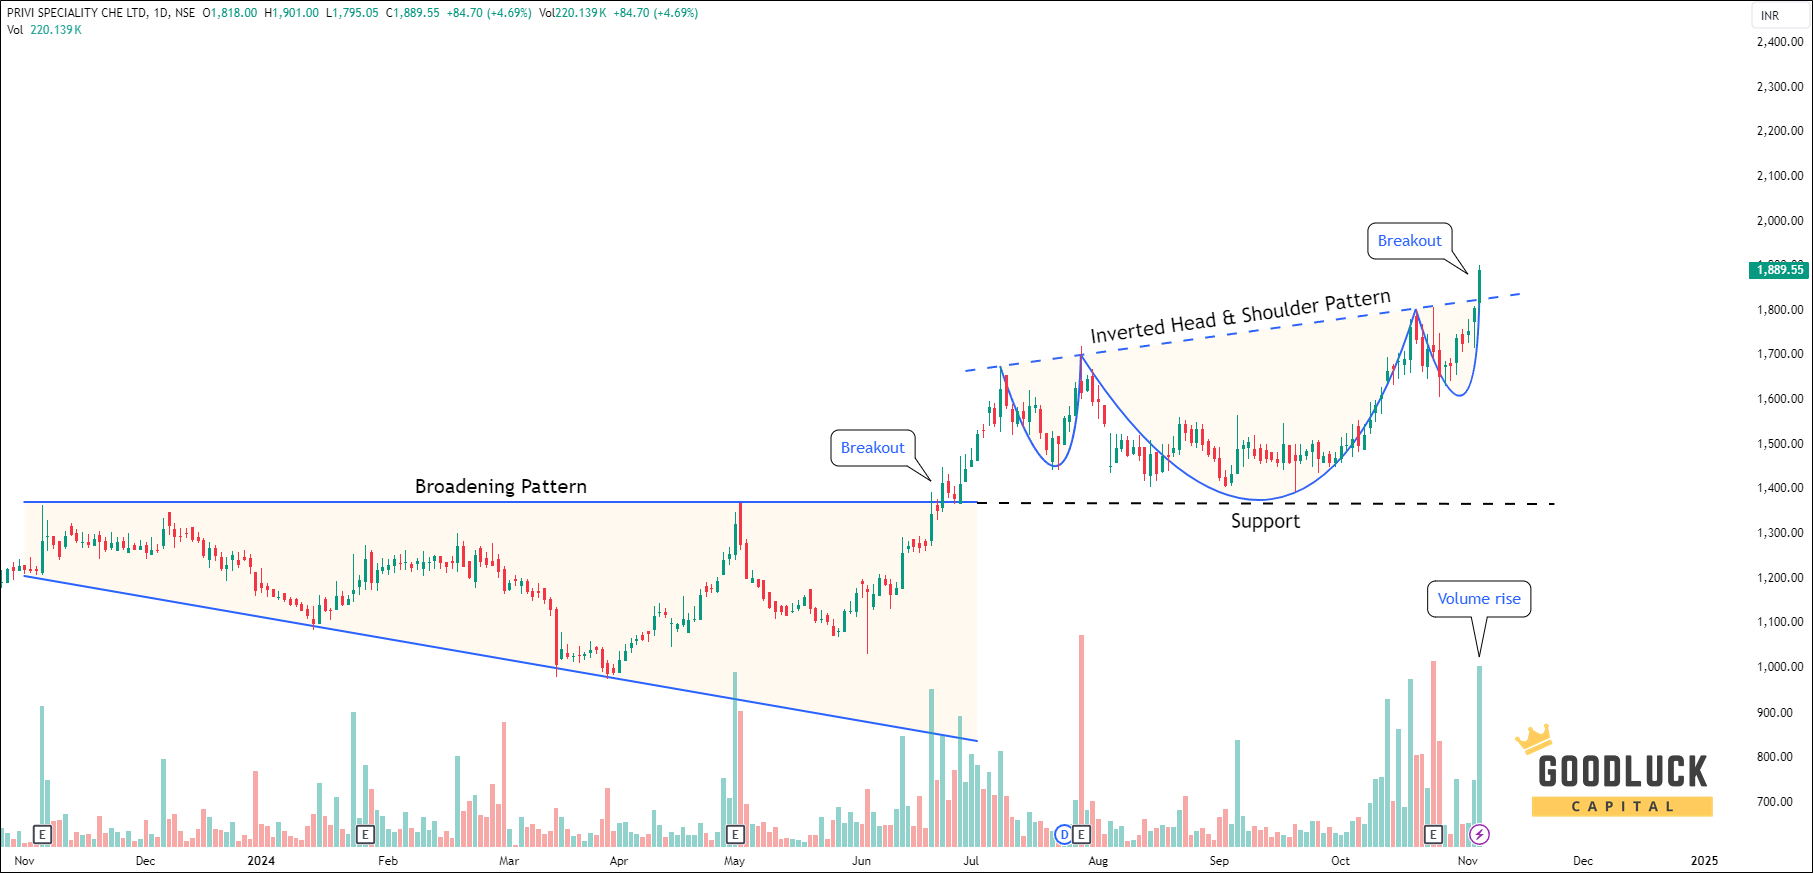
A breakout happens when a stock’s price moves decisively above a level it had trouble crossing before, called resistance, or below a level it had trouble falling under, called support. It often signals that buyers, or sellers, have finally won a tug of war that’s been going on for days or weeks.
Think of resistance like a ceiling a stock keeps bumping its head against. Every time it gets close to that price, sellers show up and push it back down. A real breakout is when the stock finally smashes through that ceiling and keeps climbing.
What Is a Fakeout?
A fakeout, also called a false breakout, is when the price pokes above that ceiling, tempting traders to jump in, and then falls straight back down. Anyone who bought expecting a big move upward is left holding a loss instead.
It’s a bit like someone poking their head through a door, making you think they’re about to walk in, then stepping back and closing the door behind them.
Why Fakeouts Happen
- Low volume breakouts. If very few shares are actually trading during the move, there isn’t enough real buying interest behind it to sustain the breakout.
- Stop-loss hunting. Large traders sometimes push a price just past a well known level, triggering a wave of retail stop-losses, before reversing direction.
- News-driven spikes that fade. A rumor or a short burst of excitement can push a stock past resistance briefly, without any lasting change in the business behind it.
- No broader confirmation. A single stock breaking out while its sector and the Nifty are flat or falling is a weaker signal than one backed by the wider market.
How to Tell the Difference
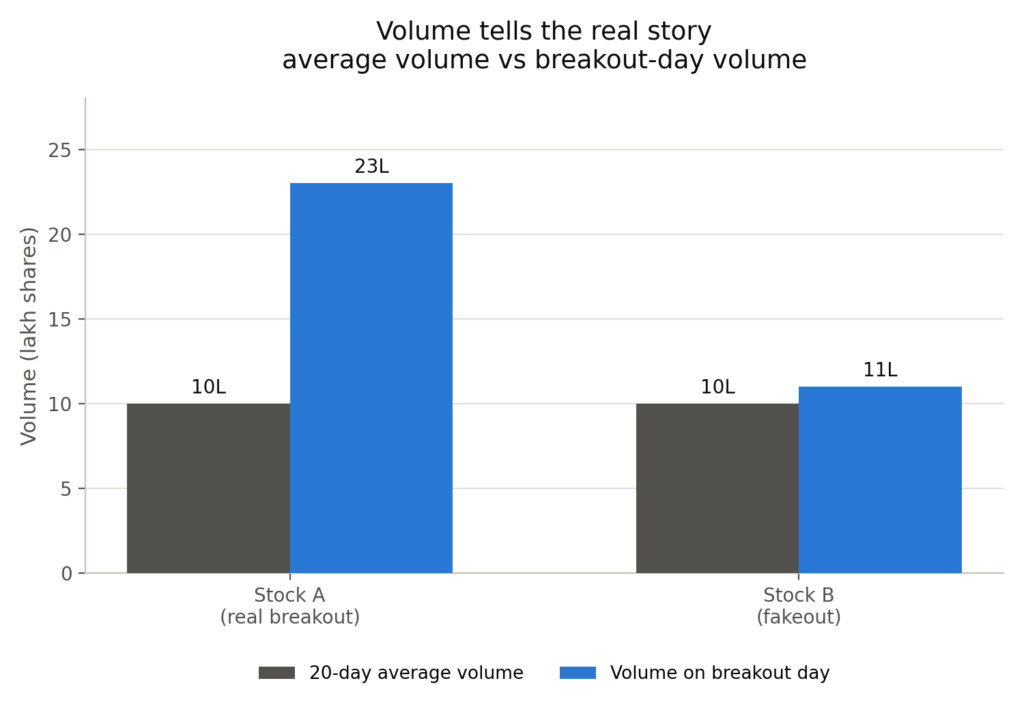
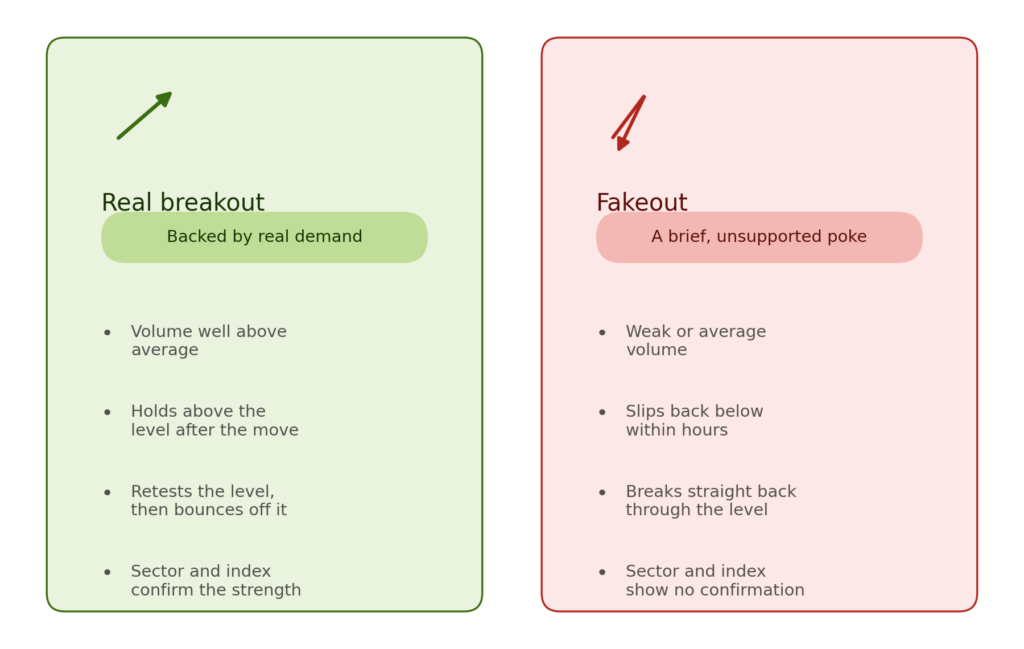
- Check the volume. A genuine breakout is usually backed by volume well above the stock’s recent average. Weak volume is a warning sign.
- Watch for follow-through. Does the price hold above the level for the rest of the session, or does it slip back within minutes?
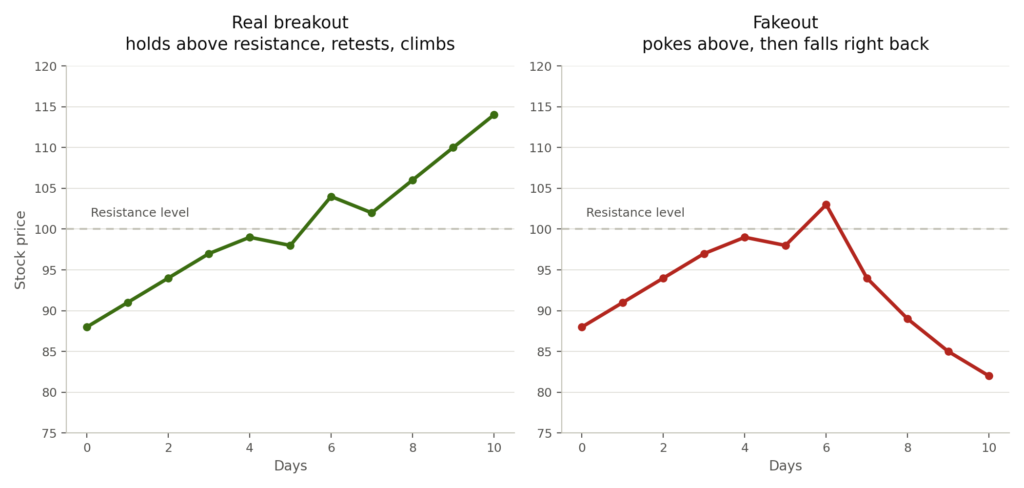
- Look for a retest that holds. Many real breakouts dip back to the old resistance level once, then bounce off it like a floor. A fakeout breaks straight back through.
- Check the sector and the index. A breakout that lines up with strength in the broader market is more convincing than one happening alone.
Two Trades, Two Very Different Outcomes
Let’s imagine two traders watching two different stocks, both breaking above a key resistance level on the same day.
Stock A breaks out on strong volume, more than double its 20-day average. It closes well above the old resistance level and holds there over the next several days, even dipping back to retest the level once before climbing further.
Stock B breaks out on weak volume, barely above its usual daily average. Within a few hours, it slips back below the old resistance level and keeps falling for the rest of the day.
How to Trade Breakouts More Safely
- Don’t chase the very first candle. Give the breakout a little time to prove itself before jumping in.
- Always check volume alongside price. A breakout without volume behind it is a weak signal.
- Use a stop-loss just below the breakout level, so a fakeout costs you a little instead of a lot.
- Watch how the broader index or sector is behaving. A breakout that lines up with overall market strength is more convincing than one happening in isolation.
For traders who prefer a more structured approach, combining technical analysis, stock selection, breakout confirmation and disciplined risk management can make short-term trading decisions more systematic. Working with a SEBI registered trading advisor can also provide a structured framework for identifying and managing such trading setups rather than relying only on the excitement of a sudden price move.
Conclusion
A real breakout and a fakeout can look identical in the first five minutes. The difference only shows up in what happens next: whether the move holds, or whether it quietly reverses back through the same door it just came through.
You’ll never catch every fakeout in advance. But checking volume, waiting for follow-through, and protecting yourself with a stop-loss means a fakeout costs you a small bruise instead of a serious injury.