Two stocks cross the same resistance level on the same morning. On the chart, both breakouts look identical. A week later, one stock is up 12%. The other is back where it started.
What was different? Not the price. The volume.
For traders exploring a swing stock trading advisory in India, understanding volume can help distinguish a breakout backed by genuine buying interest from one that may struggle to hold its gains.
What Is Volume, Really?
Volume is simply the number of shares traded in a given period. If 5 lakh shares of a company changed hands today, its volume for the day is 5 lakh.
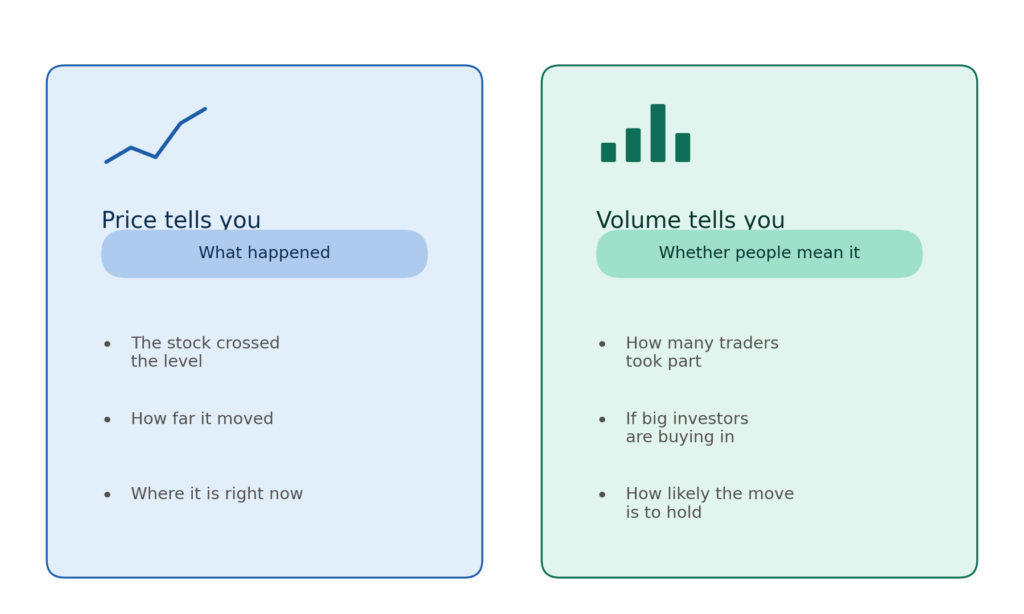
Here’s an easy way to think about it. Price tells you where a stock is. Volume tells you how many people agree.
Picture a cricket stadium. A cheer from 20 people and a cheer from 20,000 people are both cheers. But they don’t mean the same thing at all.
Why Price Alone Can Fool You
A stock can cross a price level on just a handful of trades. This happens a lot in stocks that don’t trade much. A few orders can nudge the price just above resistance, and the chart suddenly shows a “breakout.”
But if almost nobody took part, that breakout is thin. It’s a cheer from 20 people.
Price tells you something happened. Volume tells you whether it matters. That doesn’t mean price is unimportant. You still need the price to break the level. But the price move is the question, and volume is the answer.
What Volume Tells You During a Breakout
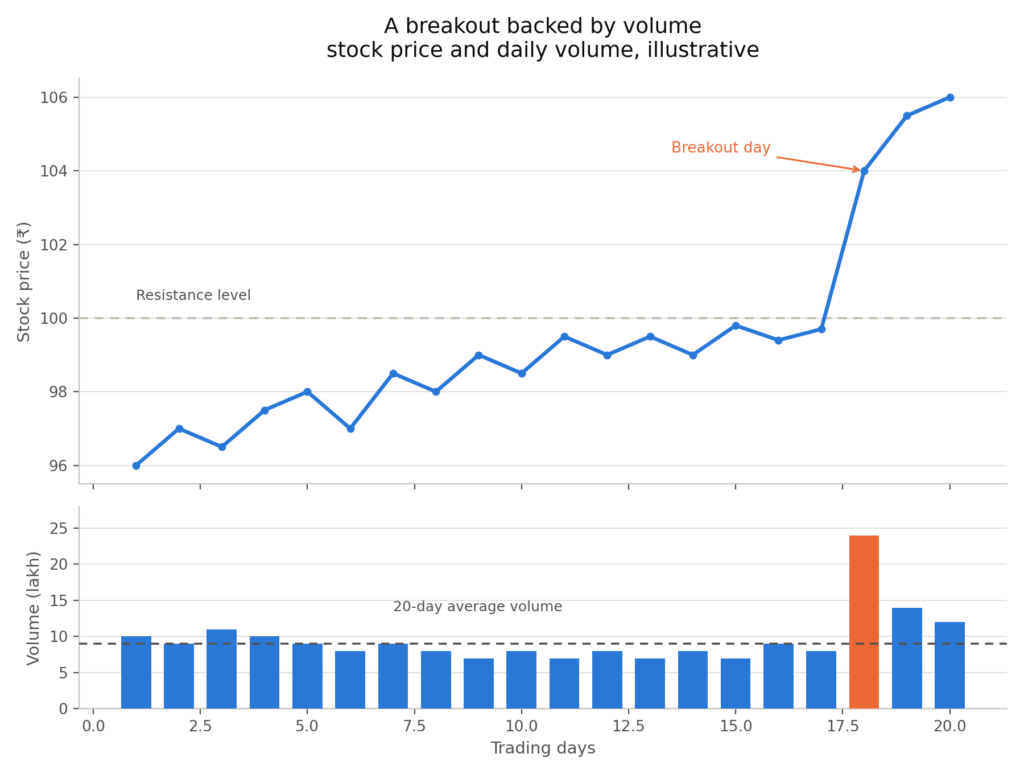
Resistance is a level where sellers have stepped in again and again. To break through it, buyers have to absorb all of those sellers. That takes a lot of buying.
Big investors, like mutual funds and foreign institutions, can’t build large positions quietly in a single trade. Their buying shows up as heavy volume. So a breakout on high volume suggests real demand has arrived.
A breakout on low volume often means something different. The sellers just paused for a moment. Nobody really stepped in to take their place.
How to Read Volume on Breakout Day
- Compare it to the average. Look at the breakout day’s volume against the stock’s 20-day average. Many traders like to see at least 1.5 to 2 times the average. This is a rule of thumb, not a guarantee.
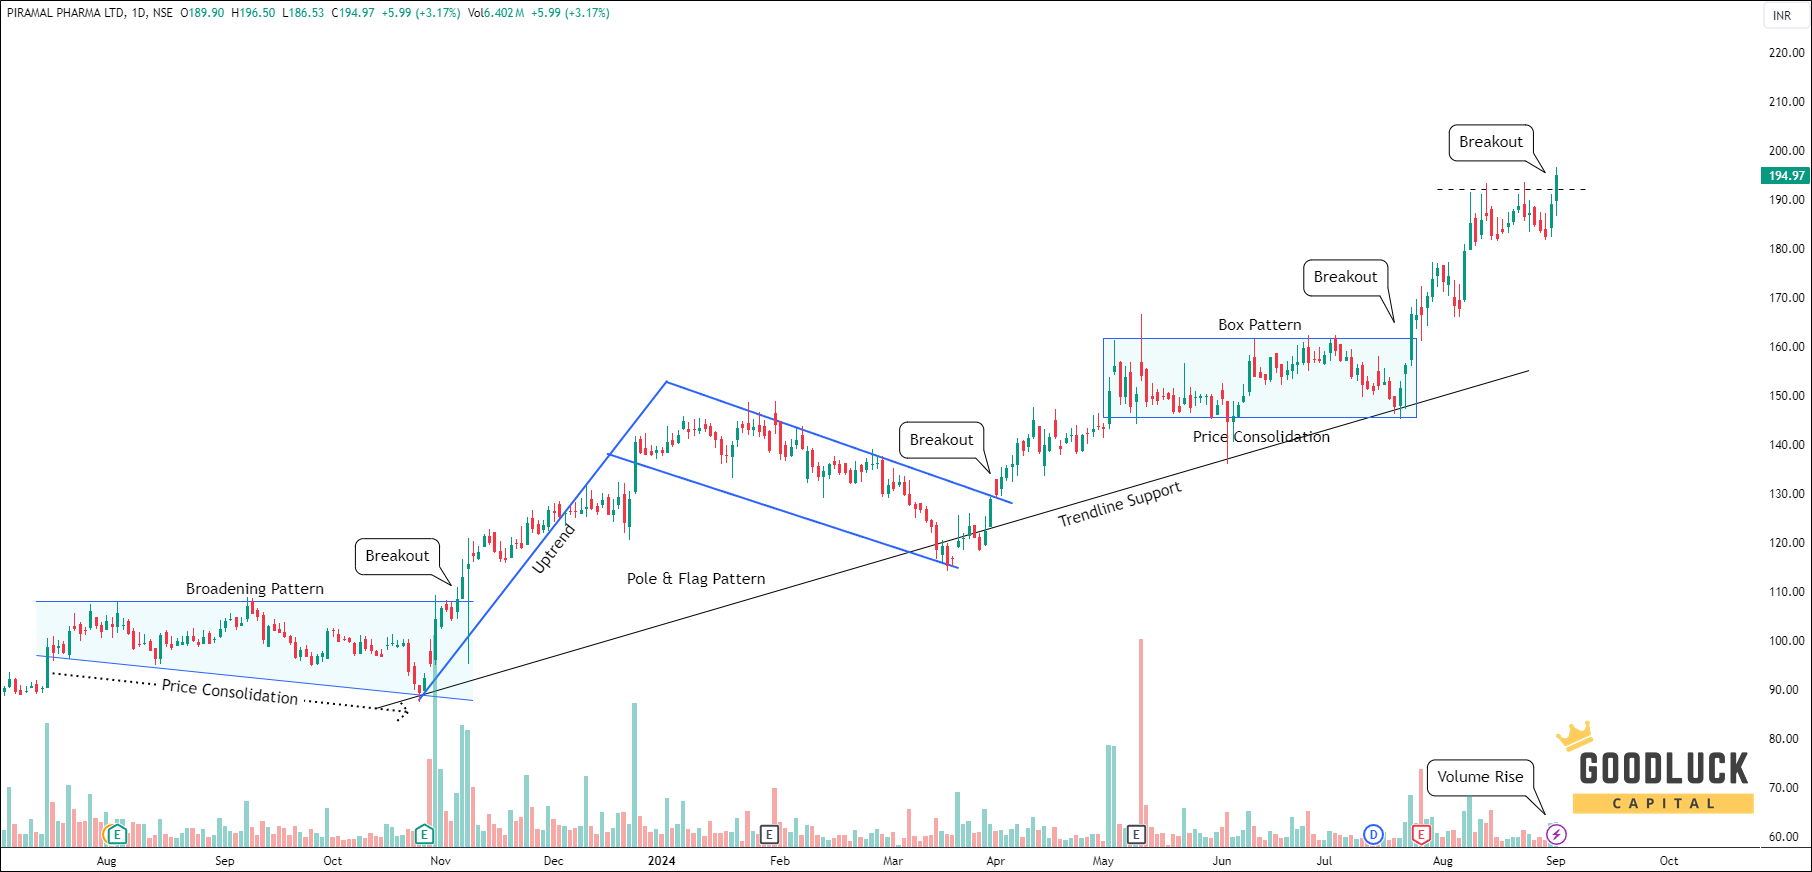
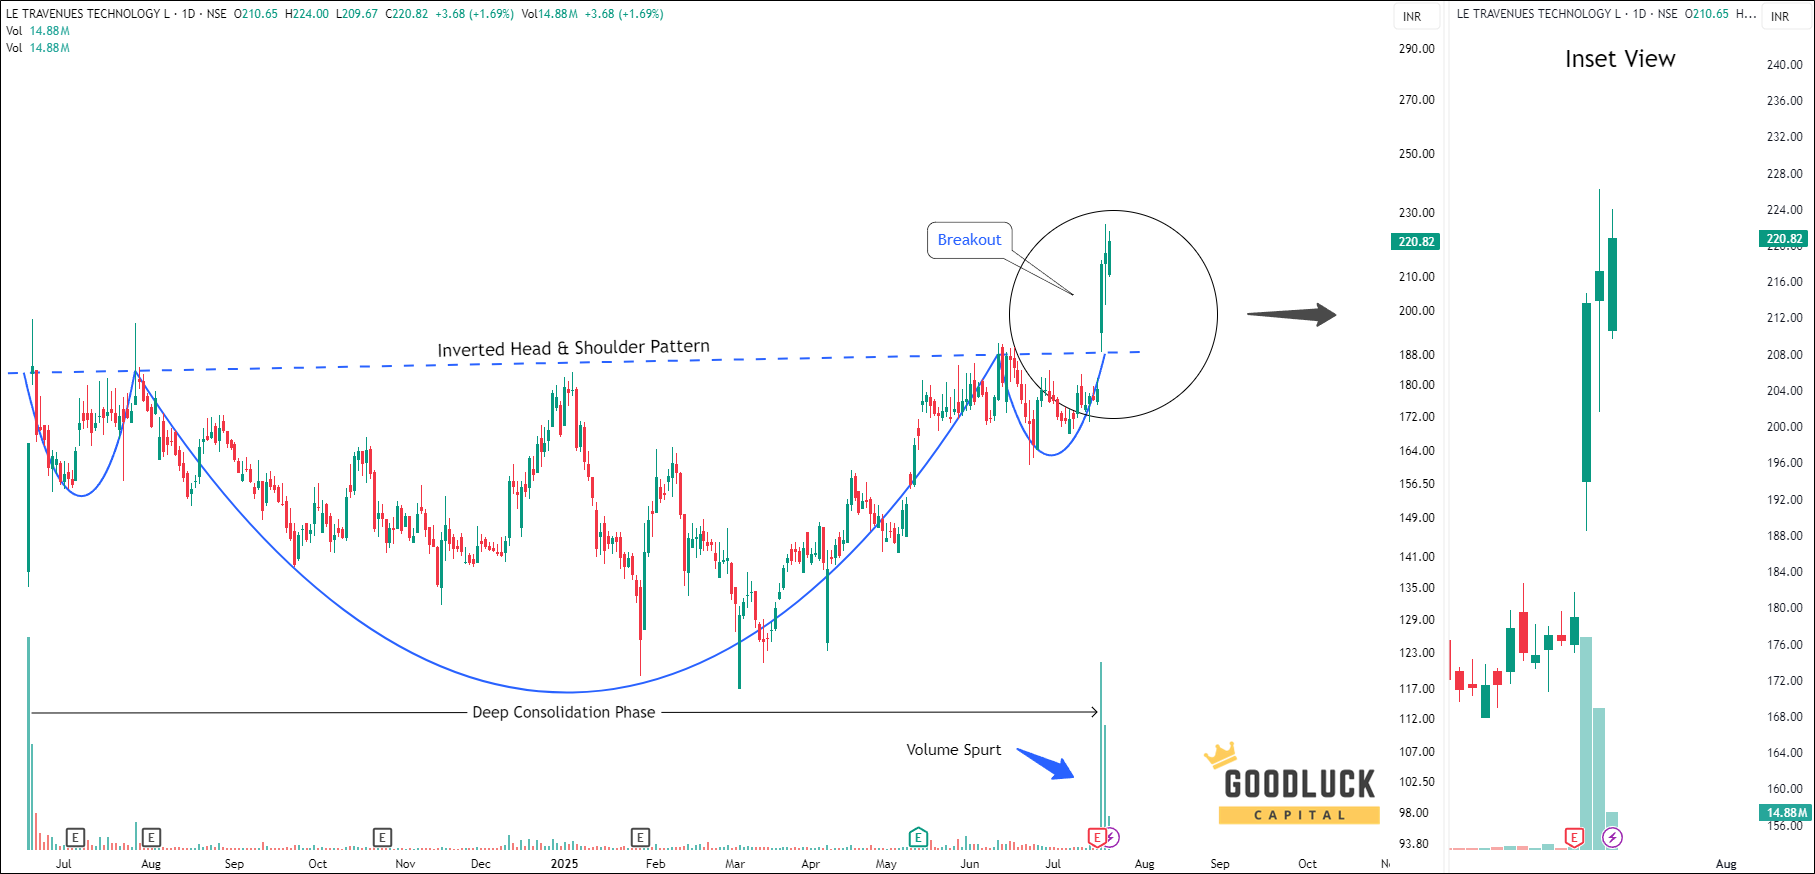
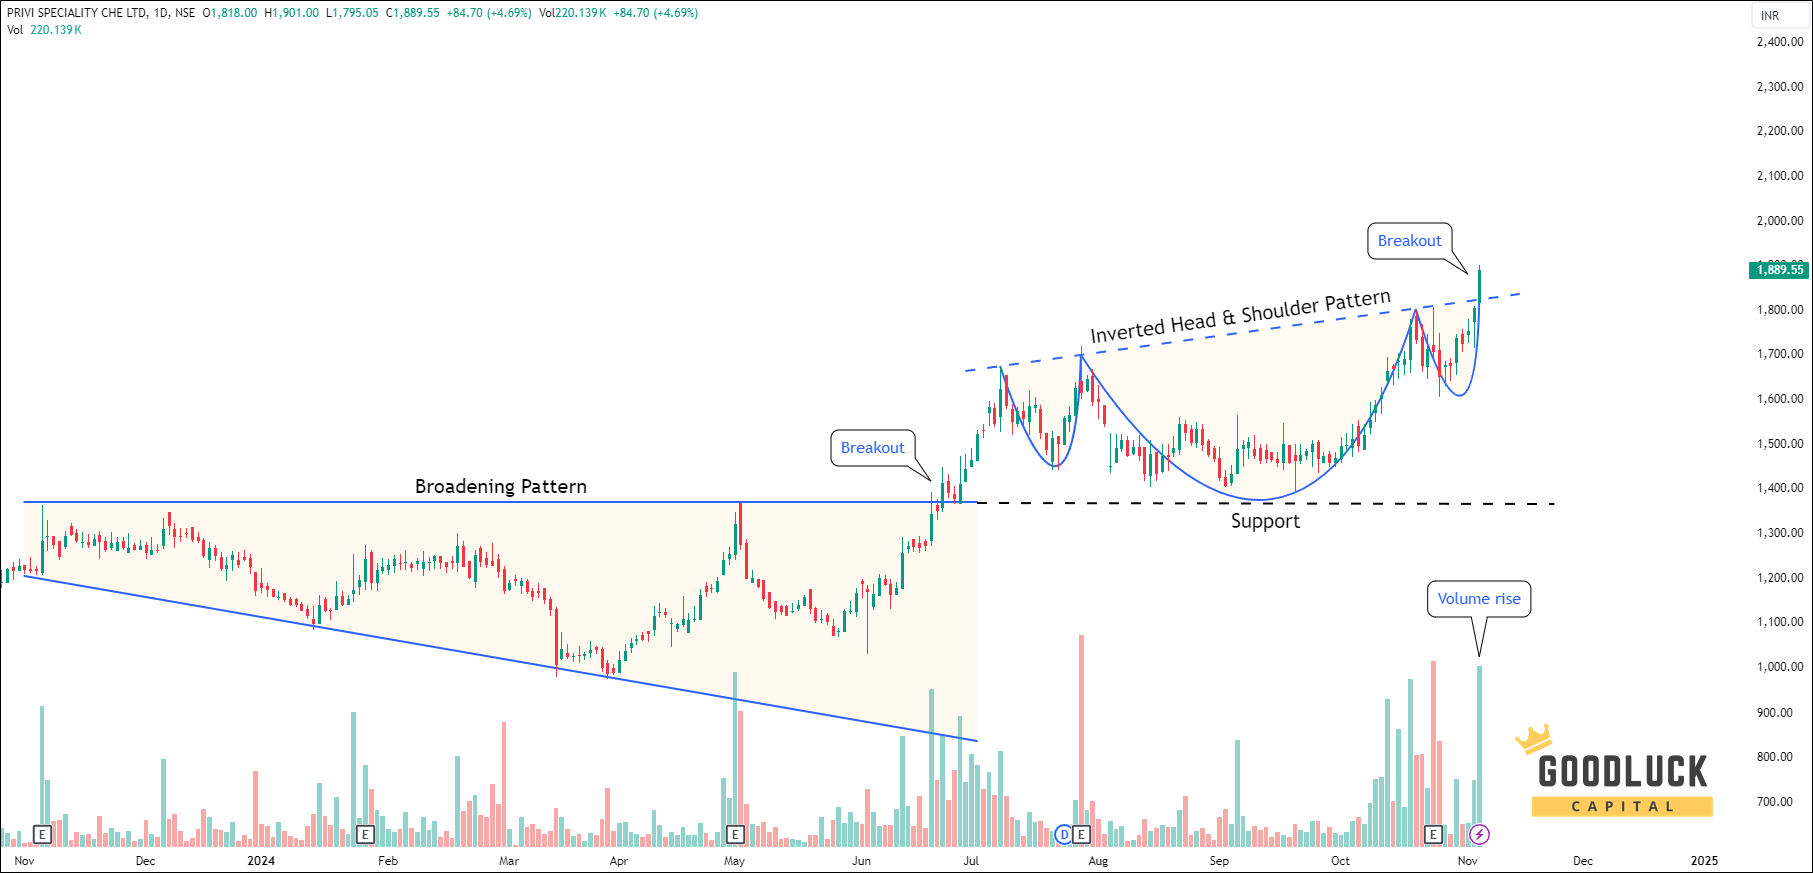
- Check the build-up. Volume often shrinks while a stock is quietly consolidating, then jumps when it breaks out. That jump is the signal.
- Watch what happens after. If the stock dips back to retest the breakout level on light volume, that’s usually healthy. A sharp drop back below the level on heavy volume is a warning.
The Indian Angle: Delivery Percentage
Here’s a tool that’s especially handy in Indian markets. NSE and BSE publish daily delivery data for stocks.
Delivery percentage shows how much of the day’s traded shares were actually taken into demat accounts, instead of being bought and sold within the same day. Intraday traders square off before the market closes, so their trades don’t count as delivery.
So a breakout with high volume and a high delivery percentage suggests investors are taking real positions, not just day traders flipping shares back and forth.
For example, a breakout on 2 times average volume with 60% delivery is more convincing than the same volume with only 15% delivery. There’s no magic number, so it helps to compare against the stock’s own normal levels.
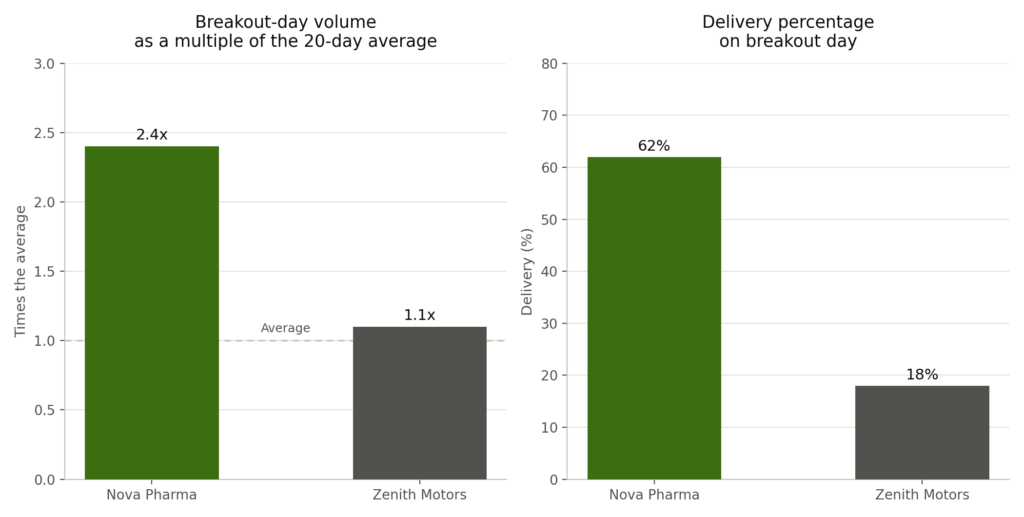
Two Stocks, Same Breakout, Different Volume
Let’s imagine two fictional stocks. Both break above a key resistance level on the same day.
| Signal | Nova Pharma | Zenith Motors |
|---|---|---|
| Volume vs 20-day average | 2.4 times | 1.1 times |
| Delivery percentage | 62% | 18% |
| Pullback to the level | Light volume, holds | Slips below within days |
| What happened next | Climbed about 12% | Back to the starting price |
Same price move. Very different conviction behind it.
What to Watch Out For
- News spikes can fade. A burst of volume from a results announcement or a rumor doesn’t always mean lasting interest.
- Be careful with thinly traded stocks. In smaller, low-liquidity stocks, volume can be driven by just a few players. Check how easily the stock normally trades.
- Volume isn’t a crystal ball. Use it together with price holding above the level, not on its own.
A Simple Breakout Checklist
- Did the price clearly break above the level?
- Was volume well above the 20-day average?
- Was delivery percentage healthy for this stock?
- Is the price holding above the level after the breakout?
If most of these are a yes, the breakout has stronger backing. If volume is missing, treat it with caution.
Traders evaluating short term trade recommendations should look beyond the breakout price and assess volume, delivery data, and the stock’s ability to hold above resistance. These factors can help identify stronger setups, although no combination guarantees a profitable trade.
Conclusion
A breakout is a lot like applause. The price move is someone standing up to clap. Volume tells you whether the whole stadium joined in.
One person clapping can be a fluke. A stadium on its feet is hard to ignore. Next time a stock breaks out, don’t just look at where the price went. Look at who showed up with it.