StopLoss*: Apply on the daily close. After the first target, reset the StopLoss to your buying price.
Duration^: Approximate holding period based on the active trading days (excluding market holidays). Actual holding may vary with the market conditions.
Upside Potential#: Based on median of the suggested buy range.
Founded in 1931, Cemindia Projects Limited is a leading engineering and construction company specializing in infrastructure projects across India.
The company executes projects in metros, tunnels, highways, bridges, ports, airports, water infrastructure, industrial facilities, and data centers, serving both government and private sector clients.
With expertise in complex civil engineering and marine construction, Cemindia is positioned to benefit from India’s long-term infrastructure and urban development investments.
Crossed a historic milestone: FY26 revenue hit ₹10,237 crore, up 9.8% YoY; net profit surged to ₹598 crore from ₹373 crore last year, the first time revenue crossed the ₹10,000 crore mark.
Profits grew much faster than revenue in Q4: Q4 revenue grew 17.4% YoY to ₹2,973 crore, while profit more than doubled, up 113.6% to ₹242 crore. Margins expanded sharply versus last year.
One-time boosts helped Q4 margins: Management clarified that around ₹100 crore came from claim realizations and provision reversals on completed metro projects, so part of this quarter's margin strength isn't fully repeatable.
Order book at an all-time high: Total order book hit a record ₹24,545 crore, with new orders of ₹14,821 crore won during the year, giving strong revenue visibility for the years ahead.
Financial Highlights
Metric
Q4 FY26 (Mar '26)
Q3 FY26 (Dec '25)
Q4 FY25 (Mar '25)
QoQ Change
YoY Change
Revenue from Operations
2,973
2,315
2,532
▲ 28.4%
▲ 17.4%
EBITDA (Operating Profit)
358
222
255
▲ 61.3%
▲ 40.4%
EBITDA Margin (OPM %)
12%
10%
10%
▲ 200 bps
▲ 200 bps
Net Profit (PAT)
242
111
113
▲ 118.0%
▲ 114.2%
EPS (₹)
14.1
6.46
6.6
▲ 118.3%
▲ 113.6%
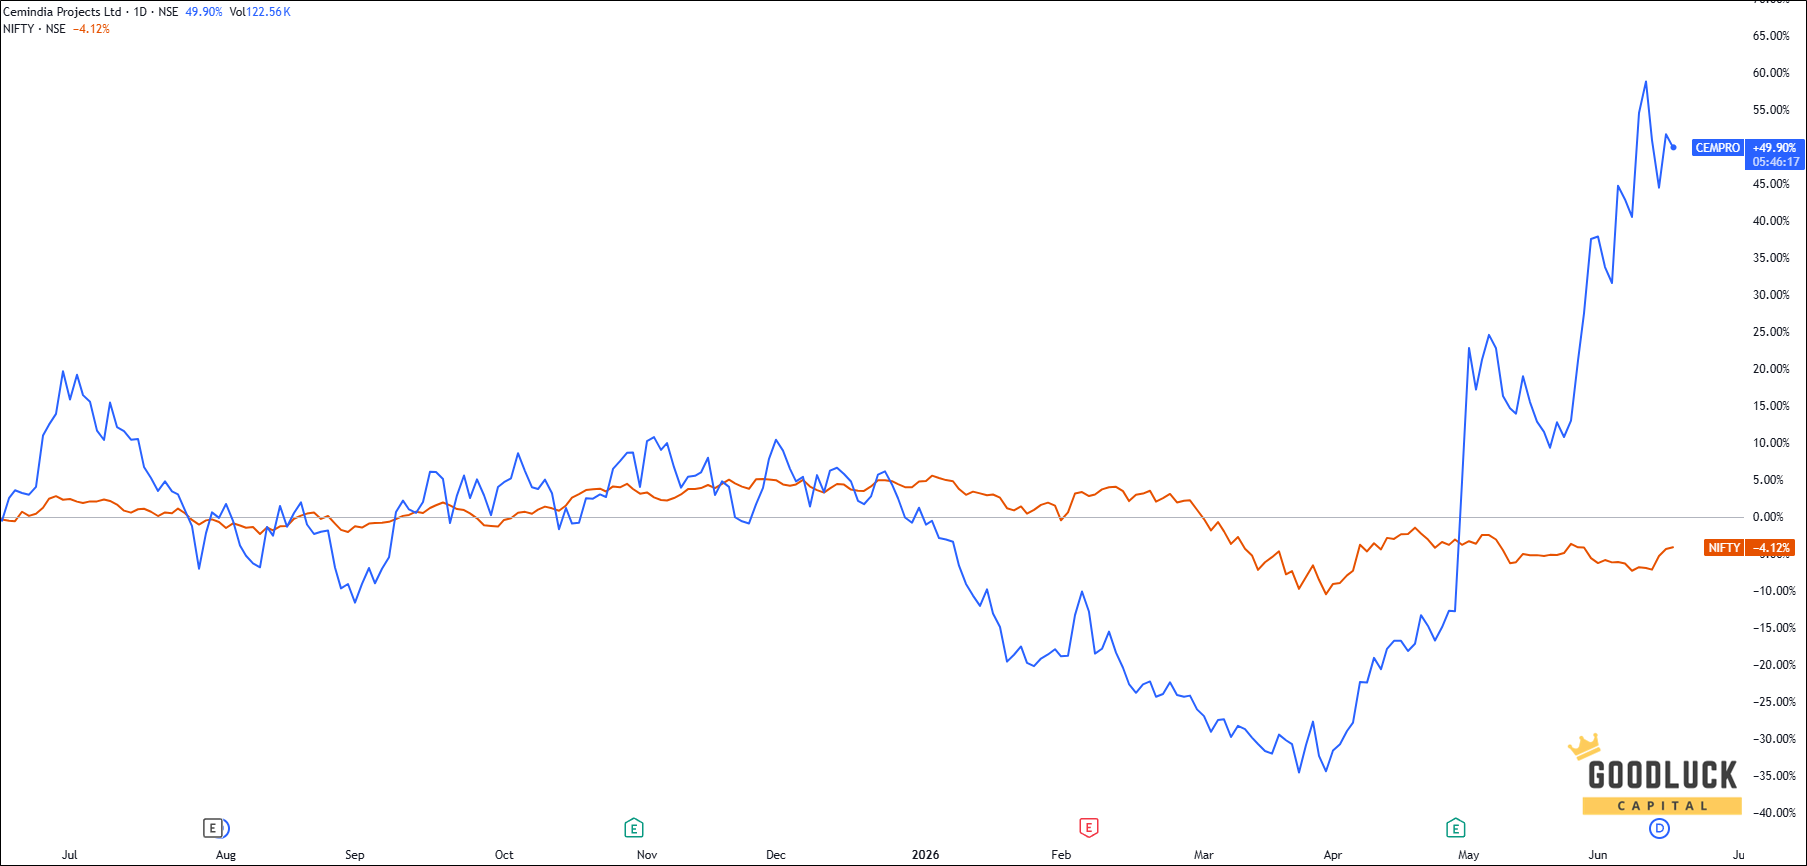
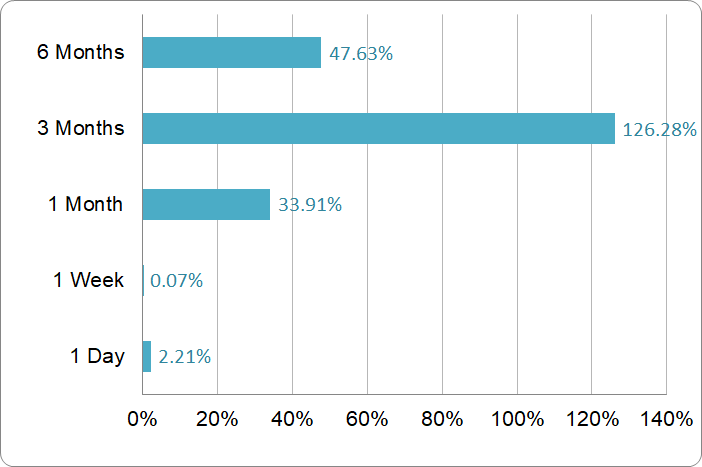
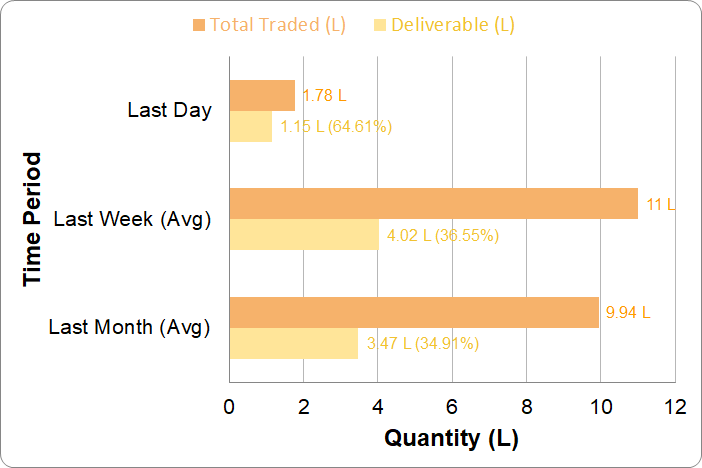
Price Performance & Volume Analysis
Price Performance
Volume Analysis
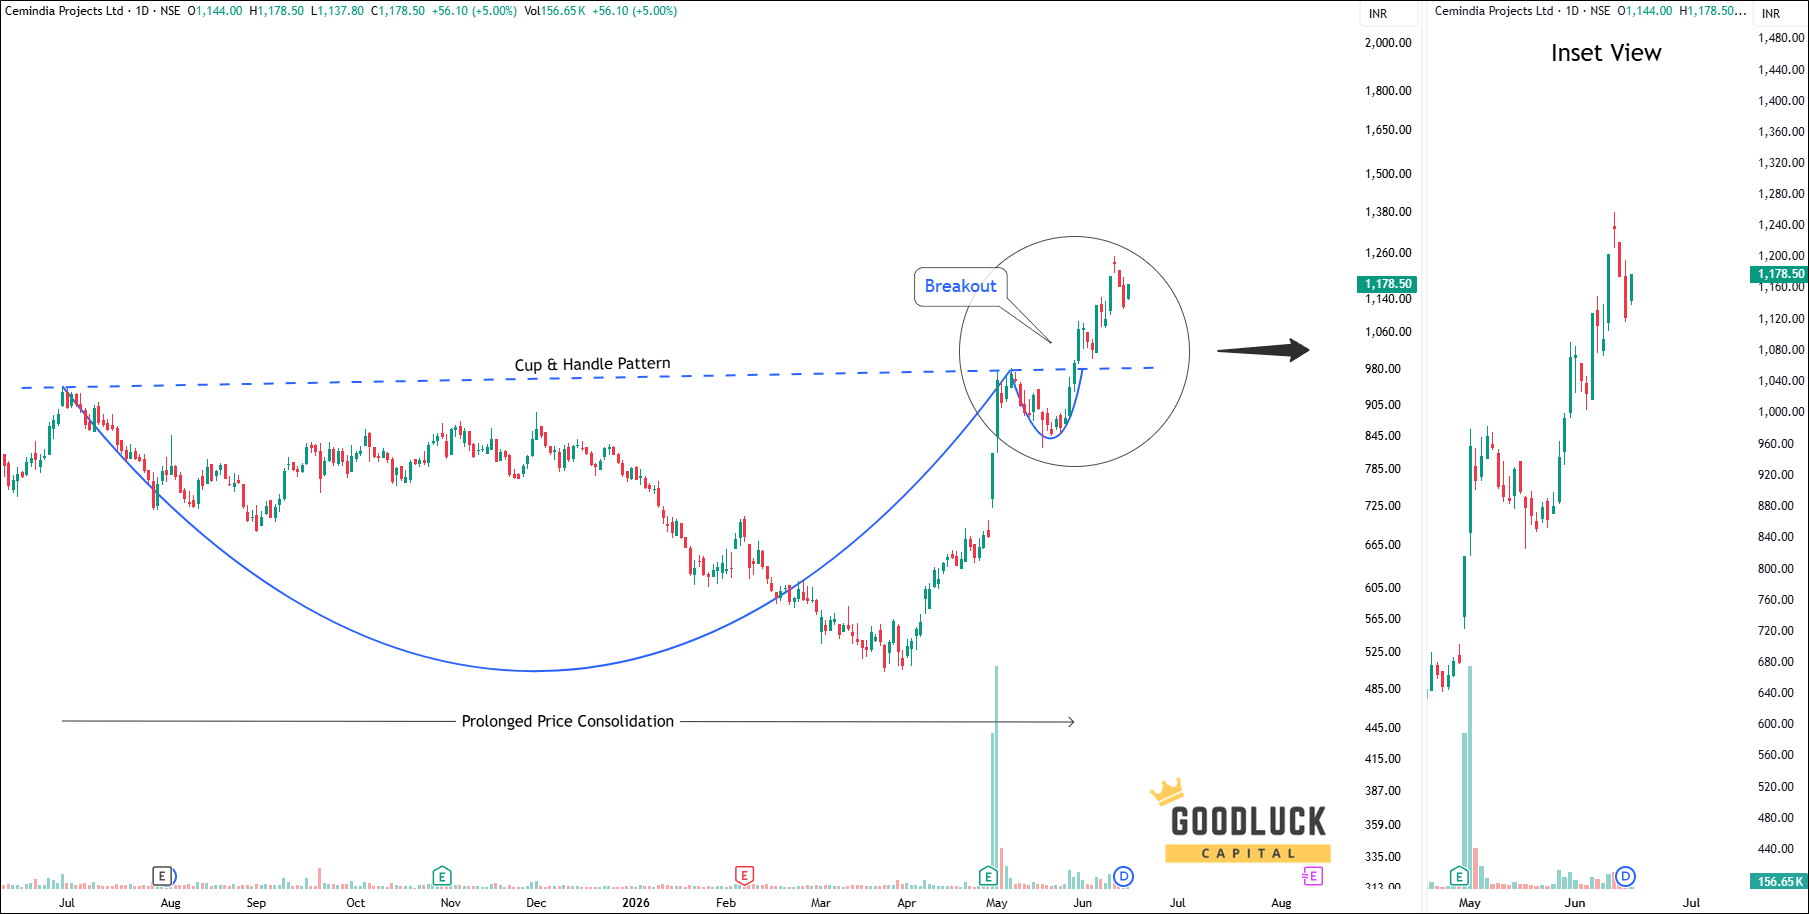
Technical Analysis
Key Observations
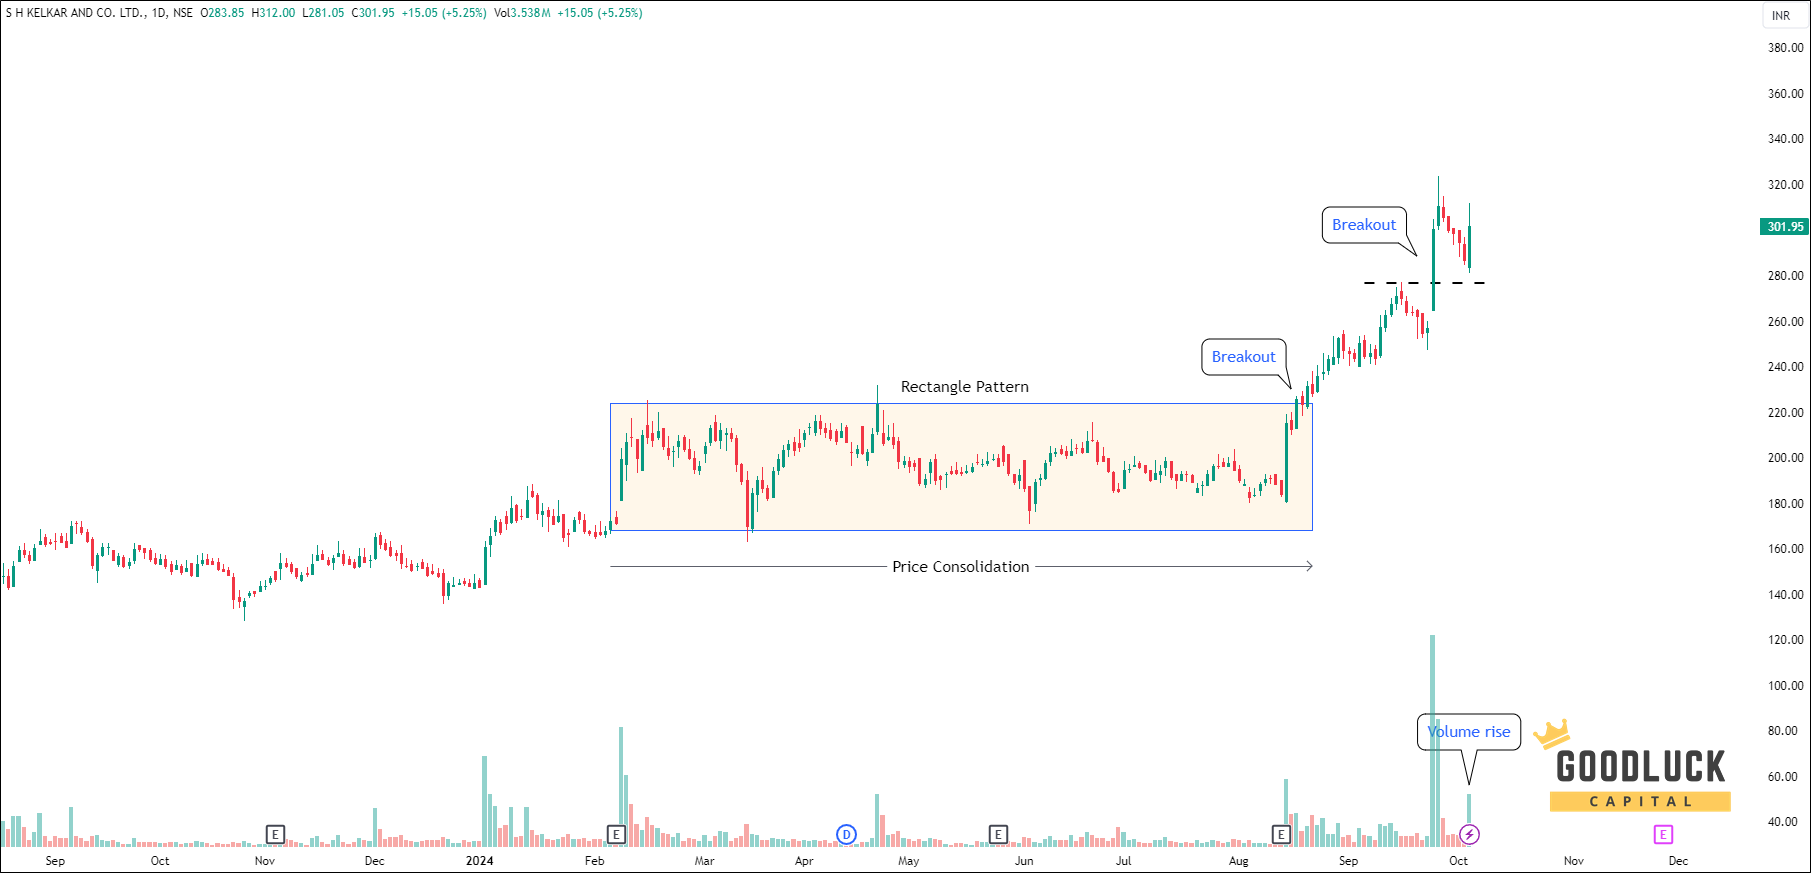
The stock has confirmed a Rounding Bottom breakout, indicating a shift from accumulation to a bullish trend.
After the breakout, the price successfully retested the breakout level and found support, confirming the strength of the move.
The stock is now showing renewed buying momentum and may continue its upward move from current levels.
Based on our positional trading strategy, the Cemindia Projects stock price target will be INR 1170 - INR 1190 in the next 12-14 trading sessions.
MONEY MANAGEMENT AND TRADING RULES
Buy within the recommended price range. You may allow up to 1% flexibility beyond the range if needed.
No need to rush. The recommendation remains valid for up to 7 days, not just at market open.
Use a trailing stop-loss to protect and lock in profits.
Diversify your trading capital across our other recommended stocks to reduce risk.
Invest responsibly. Trade only with funds you can afford to lose and hedge positions where appropriate.
Analyst Summary
The research analysis is prepared by Arijit Banerjee, CMT, CFTe. He is a veteran trader and an active investor having in-depth knowledge in financial market research, advanced technical analysis, market cycle, algorithmic trading and portfolio management. Arijit is a Chartered Market Technician (CMT) accredited by CMT Association USA, the leading global authority of Technical Analysis and has been honoured by Certified Financial Technician (CFTe) from the International Federation of Technical Analysts, USA. SEBI, the regulatory body of Indian financial market also recognizes him as a Research Analyst (INH300006582).
The views expressed herein are based solely on information available publicly/internal data/other sources believed to be reliable, but is not necessarily all-inclusive and is not guaranteed as to accuracy. The recommendations provided herein is solely for informational purposes and are not intended to be and must not be taken alone as the basis for an investment/trading decision. Trading and investing are subject to market risk and the securities discussed and opinions expressed herein may not be suitable for all investors. To read the full disclosure, please click here.
Your Return Could be Much Better
Increase your Profitable!
Swing Trading Advice
10—12 swing trade advice / month
expected upside 6%—8% per trade
short term trade holding 1-2 weeks
minimum capital required ₹ 3-lakh
receive trade advice before 9:00 am
trade ideas by blackbox system, relied on statistics, technical, fundamental, macroeconomics and sentiment